Used methods
A pyramid approach
The same amount of information is not available for all ecosystem services. Therefore, we propose a pyramid approach as described in Kettunen et. al. (2009). Initially, as many services as possible are described and a qualitative rating is given. This is done through scores that indicate the extent to which ecosystem services are provided by a particular area and how this delivery is influenced by specific interventions. This has not yet happened for all ecosystem services due to the lack of scientific knowledge about specific ecosystem services.
Secondly, we establish functions for a smaller selection of ecosystem services to quantify the bio-physical impact of a scenario (quantitative valuation). This selection is based on the availability of data and the scientific credibility of quantification functions. Ecosystem services for which there is too little scientific information or consensus remain in the first group. Finally, starting from the quantification, we will also develop functions or key figures for an even smaller group of ecosystem services to determine the monetary value.
The advantage of this approach is that we value the most complete bundle of ecosystems possible. As Kosoy and Corbera (2010) point out, valuation exercises that examine only one ecosystem service are misleading. Focusing solely on one ecosystem service, such as fishing, can lead to unsustainable use and have disastrous effects on other ecosystem services.
Valuing a bundle of ecosystem services does not mean valuing everything. The monetary valuation of the current value of all ecosystems is in itself of little significance for policy because without biodiversity our life on earth is also impossible. Decision makers are more interested in valuing marginal (relatively small) changes that occur in the provision of ecosystem services. Therefore, we need to appreciate different alternatives, scenarios or land use changes.
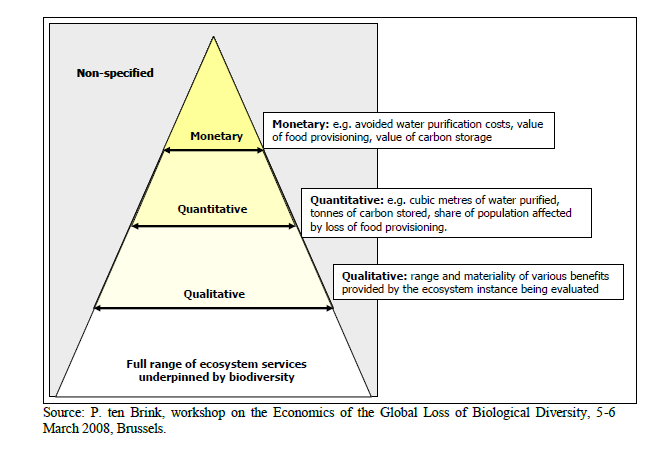
source: translation of Kettunen et al. (2009)
Identification: qualitative valuation
The qualitative rating indicates with a score from 1 to 10 whether or not a specific ecosystem service is important in a certain area, and whether this service improves or deteriorates when a certain policy or project is applied.
Identification of ecosystem services addresses the following questions:
- What are the ecosystem services provided by areas and how important are these services?
- What are the factors that determine the extent of the services provided? These are briefly listed per service in Appendix B.
- Do these influencing factors change between scenarios?
There are 3 types of factors that influence the importance of an ecosystem service:
- Supply from the physical system: Suitability/preconditions from the physical system (is the area suitable from an abiotic point of view to provide a certain ecosystem service?)
- Supply from land use/land cover: Is the ecosystem service effectively delivered for a certain land use/ecosystem status?
- Question: Needs of society to provide an (additional) service in a certain area.
From these 3 perspectives we can identify and combine different suitability factors. Based on expert advice and combinations of these suitability factors, we can then assign scores that indicate how important a service is.
This method is primarily pragmatic and identifies the most important changes in ecosystem services provided within an area. This qualitative valuation is a step towards the services to be quantified/valued, quickly makes it clear which ecosystem services are relevant for Flanders and also indicates that we cannot yet quantify important services with current scientific knowledge.
Quantify: quantitative valuation
The quantitative valuation focuses on numerical data: We measure the change in ecosystem services that is the result of a change in land use in terms of physical impact on, for example, production (tonnes of biomass), pollution (kg of pollution load reduction) or recreation (number of visits).
In this manual, we mainly use statistical analyzes of models from literature and empirical research for the quantitative assessment. To quantify ecosystem services, we translate the underlying ecological processes as much as possible into easy-to-use formulas or key figures.
These functions are always a trade-off between the available knowledge and the calculation time of the tool. We do not use extensive process-based models that are available, for example, to calculate the impact on flooding, erosion loss or nutrient removal. Such exercises are very extensive and cannot be carried out in the short term for an exploration of a wide range of services. Where information is available, we do refer to extensive models in Flanders that can be used to quantify certain biophysical processes in more detail.
In order to take the uncertainty within the functions into account as much as possible, we try to determine, as far as possible, a low and high value within which the actual rating lies.
The units in which services are quantified are specific to each service. It is therefore not possible to add and compare services based on the quantitative valuation. This method does indicate well the extent to which the delivery of services changes between scenarios.
Monetary appreciation
Monetary valuation is the expression of the effects on ecosystem services in monetary terms. This can be done on the basis of various methods from environmental economics. We give a brief description of different methods that are possible. More details can be found in LNE (2008). Later in the manual we indicate which method we use for each ecosystem service. In this figure you can also see for which values these methods are most suitable. All monetary units are expressed in €2019.
Here too, when we have multiple sources, we try to take the uncertainty in the figures into account and provide a low and high value.
Market prices
If market prices are available, they are used because they provide information about the minimum price the buyer is willing to pay (and therefore say something about the buyer's willingness to pay and preferences), about the price the vendor wants for those services or goods. and the resources that have to be sacrificed for this (raw materials, energy, capital and labor that we cannot use for something else).
There are few ecosystem services that are traded on a market. Moreover, there is little information about the amount of goods that an ecosystem provides and the cost of obtaining the goods, so we often have to rely on other methods to value ecosystem services.
Avoided reduction costs
Reduction costs are the costs of measures required to reduce certain pollutants in the environment, such as nitrogen in the water. An ecosystem service can reduce concentrations and ensure that certain measures do not have to be taken and thus avoid reduction costs. The cost per unit of emission reduction (e.g. per kg of nitrogen) of the last measure just necessary to achieve an environmental goal reflects the costs that society is willing to pay to achieve the environmental goal in question. This is called the marginal reduction cost and can be used as an approximation for the value of this ecosystem service. This approach is less good than the methods below because the connection with people's preferences and willingness to pay is less direct. There is an indirect connection because when choosing policy objectives - such as on nutrients and climate change - the policy takes into account both the possible consequences of these problems and how people value them, as well as the costs of measures to solve these problems.
To apply this method, two types of information are needed:
- specific environmental goals;
- the costs of measures to achieve those goals, ranked according to cost-effectiveness.
Damage costs avoided
Damage costs are costs resulting from damage, for example due to pollutant emissions or flooding. Environmental health costs are a form of damage costs. The marginal damage cost is the additional cost for an additional unit of damage inflicted.
If an improvement in ecosystem services leads to less damage, e.g. by avoiding a flood or removing pollutants, then the value of this avoided marginal damage cost can be used to value the ecosystem service. To do this, there is a need for good studies with information about the avoided damage costs to health or the economy and the relationship with the ecosystem service.
Factor costing method
This method values the contribution of the ecosystem to the added value of a product. Green space is considered an input in the production process in addition to capital and labor. This method is rarely used.
Revealed (shown) preferences
In this case, people's preferences and willingness to pay are inferred from their behavior in existing markets. There are two major groups:
Hedonic pricing method (HP) By paying more (less) for the same home in an environment with a better (worse) environmental climate, people express their preference for this environmental variable (for example, proximity to a forest or noise pollution). Through a statistical analysis, the willingness to pay for the reduction of nuisance or for the presence of a good/service is then estimated based on the value of the real estate.
Travel Cost Method (TC) This method is mainly used to determine the recreational value of an ecosystem. It is based on the idea that experience values are associated with a cost incurred to use the service (direct expenditure such as transport costs, entrance fee and opportunity costs of time spent).
Stated preferences
A survey directly assesses the respondents' willingness to pay for a specific good or service. One creates a hypothetical market and there are many difficulties associated with it. The criticism of monetary valuation is greatest in the case of stated preference methods, because it is not always clear what people value and whether they are not responding strategically. We distinguish different ways of inquiring. Much of the criticism has been addressed by improving the methods.
The first is the contingent valuation method (CVM). This uses surveys to find out how much people are willing to pay to protect or improve a particular ecosystem and the services it provides. Alternatively, in the event of a possible deterioration of an ecosystem, one can use surveys to try to find out the minimum amount people are willing to accept as compensation for the loss or degradation of the ecosystem and the services provided.
A second form of inquiring is done via choice modeling (CE). This technique requires people to choose between different alternatives, which are often presented on a choice card. The alternatives consist of the same elements (attributes) but with different interpretations or levels. An example is shown below: in the two alternative scenarios (A and B) one of the elements is species richness, but in scenario A the species richness is low, while for scenario B it is high. Scenario C is 'do nothing'. The situation remains as it is and those surveyed do not have to pay anything. If they were to choose scenario A or B, they would be offered that 'total package' for the stated amount of money. In this practice example, the vast majority will probably choose B over A. A great bird lover might choose A, because that biotope is rather rare and necessary for certain species.
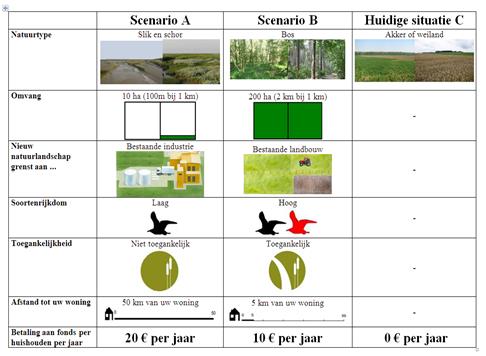
Source: Liekens et al., 2009
Benefit transfer
Benefit transfer is not really a monetary valuation method. It is a method to translate information from existing valuation studies into your own case study. If an existing study is sufficiently consistent with your own case study, values can be taken from it. This must be handled with caution, as valuation is context and time specific. Despite the challenges in applying benefits transfer, it can be a good alternative to the original valuation methods that can be complex, expensive and time-consuming.
Value transfer: We take the value from a similar study and use it for the area studied. The value can possibly be adjusted to, for example, the purchasing power of the region if this differs from that in the original study. When we use this method we will define a low and high value from the literature. These two values then represent the breadth from the literature.
Function transfer: Instead of transferring the value, a function is estimated that takes into account the various influencing factors (both characteristics of the area and characteristics of the respondents). In this way, the rating can be adapted to the situation of the study area.
Translation into indicators
The rating figures are not always easy to communicate. Is an additional carbon storage of 100 tons a lot or not? A decrease in food production of €125,000 is that a lot or not? Recreational benefits of €25,000? For this reason, we have also tried to translate the valuation figures into more understandable indicators, e.g. carbon storage equals the emissions of x people, food production equals the consumption needs of x people, x jobs in the recreational sector. Each service explains which indicators we have chosen and how they are calculated. The indicators are also classified in the dashboard depending on who is affected by the change in the delivery of ecosystem services: society, the user or the owner of the land.
The figures used to calculate these indicators come from the MIRA report on the ecological footprint of Flanders (<https://www.milieurapport.be/publicaties/2014/actualisatie-van-de-ecologische-voetafdruk-van- flanders-the-years-2004-2013-2009-according-nfa-edition-2010>); the Environmental Cost Model (Broekx et al. 2008) and key figures for external costs of car traffic (COPERT 2016).