Function 3 Conversion of coniferous forest to deciduous forest or heathland
Description
This function values the conversion of coniferous forest to deciduous forest or heathland. The results of various surveys show that there is a positive willingness to pay for both conversions, but that deciduous forest is valued more highly than heathland. The willingness to pay strongly depends on the proportional change in land use. If the ratio between the amount of constructed heathland compared to the total existing area of coniferous and deciduous forest and heathland in the study area increases sharply, the value per hectare decreases. In other words, if the variation in the area becomes smaller because coniferous forests almost completely disappear, then the respondents' willingness to pay decreases. This applies more to heathland than to deciduous forest.
Required input data:
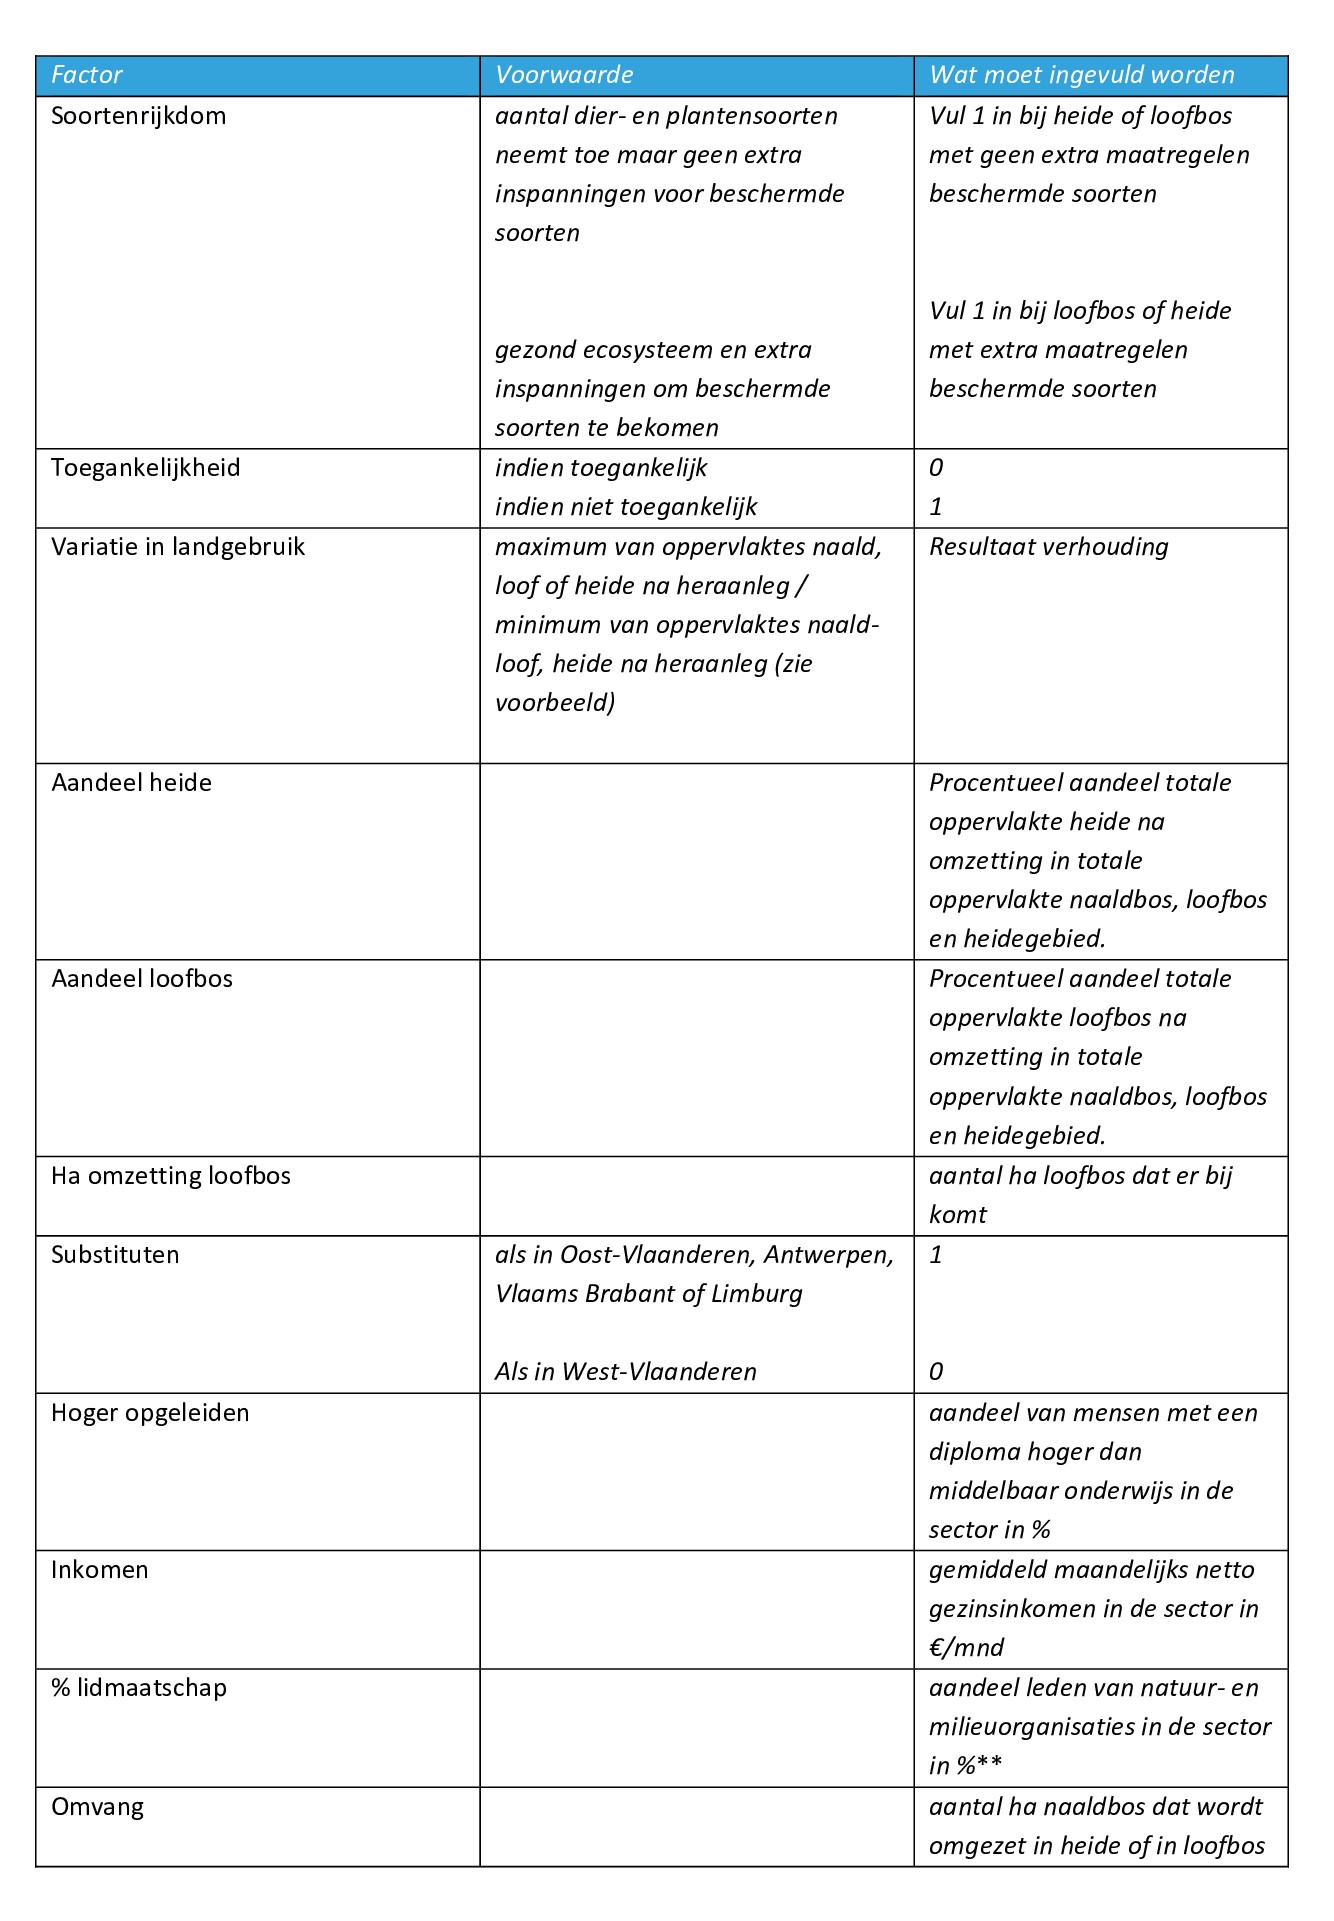
- number of hectares of coniferous forest, deciduous forest and heathland in the current area
- number of hectares of coniferous forest converted to deciduous forest
- number of hectares of coniferous forest converted to heathland
- are additional efforts being made to obtain protected species?
- List of sectors in a radius of 50 km around the study area (bird's eye view distance between the center of the area and the center of the sector may not exceed 50 km) (automatic in tool).
- accessibility of the area after conversion
Quantitative and monetary valuation
Willingness to pay was estimated via choice experiments for 3 different areas (Drongengoed, Lovenhoek and Turnhouts Vennengebied). More information about the results per area can be found in the background documents on the Nature Value Explorer website.
Assumptions
- The same reasoning as for function 1 has been followed to translate the results of the study into an applicable function.
- The function cannot be combined with other willingness-to-pay functions
- The presence of substitutes in the municipality is calculated by calculating the percentage of the surface area that has a green spatial designation in 2025 for each municipality. If this is greater than 20%, we enter 1 in the formula (https://provincies.incijfers.be/dashboard/natuur/natuurbeleid)
Functions to use
Low estimate:
BTB = area of coniferous forest in ha that is converted to heathland x (0.017 if no additional measures for protected species + 0.028 if additional measures for protected species – 0.010 if no longer accessible + 0.00026 x variation - 0.054 for the presence of substitutes for nature in the municipalitye + 0.0045 x % higher educated + 0.0000037 x income + 0.021 x % members of nature or environmental association) + area of coniferous forest in ha that is converted to deciduous forest x (0.030 if no additional measures for protected species + 0.038 if additional measures for protected species – 0.010 if no longer accessible + 0.00026 x variation – 0.037 x share of deciduous forest – 0.00011 x number of ha conversion of deciduous forest – 0.0026 for the presence of substitutes for nature in the municipalitye + 0.0045 x % higher educated + 0.0000037 x income + 0.021 x % members of nature or environmental association)
BTB is greater than or equal to zero (it cannot be negative)
High estimate:
BTB = area of coniferous forest in ha that is converted to heathland x (0.074 if no additional measures for protected species + 0.11 if additional measures for protected species – 0.022 if no longer accessible + 0.0013 x variation - 0.12 x share of heathland – 0.0052 for the presence of substitutes for nature in the municipality + 0.022 x % higher educated + 0.000014 x income + 0.073 x % members of nature or environmental association) - area of coniferous forest in ha that is converted to deciduous forest x (0.11 if none additional measures for protected species + 0.14 if additional measures for protected species – 0.022 if no longer accessible + 0.0013 x variation – 0.080 x share of deciduous forest – 0.00021 x number of ha conversion of deciduous forest – 0.0052 for the presence of substitutes for nature in municipality + 0.022 x % higher educated + 0.000014 x income + 0.073 x % members of nature or environmental association)
BTB is greater than or equal to zero (it cannot be negative)
- Distance to sector and parameters per sector: For each sector for which the valuation function gives a positive result, fill in the function with the above parameters and the following specific sector parameters:
- percentage of higher educated people
- average monthly disposable family income
- percentage of households that are members of a nature or environmental organization: for Flanders this is an average of 8%.
- Province in which sector is located
You can also use the Excel table in the Nature Value Explorer which contains figures for 2021. You can find this in the background documents at https://natuurwaardeverkenner.be/. Of course, you can also let the tool do the research and calculation work. The web tool automatically searches this data for all sectors within a radius of 50 km and then calculates the functions.
An example
For the example, we refer to the Dutch version of the manual.