Function 1 Creation of new nature or disappearance of nature
Description
The value of this function provides an estimate of the value for the cultural services of a conversion from an agricultural ecosystem to a natural ecosystem. The function can also approximately be used for the disappearance of nature in favor of infrastructure, but this results in an underestimate of the value, because on the one hand the disappearance of something familiar is classically experienced as more drastic, and on the other hand the additional loss of experience and transfer value from agriculture to urban land use is not included.
Function 1 can also be used to value changes in land use that are not offered in another function within a nature reserve, e.g. heathland to grassland, heathland to forest, etc.
Required input data:
- % of the different ecosystems in the area
- species richness: high if the area is a healthy ecosystem and/or contains rare species in Flanders (red list species). If neither of these conditions applies, indicate no. If one of the two conditions is met for the entire area, enter yes. If this only applies to part of the area, indicate to which percentage (area) of the area this applies. The percentage does not provide an estimate of the level of biodiversity. For an existing area, you can possibly consult the Biological Valuation Map (BWK) (code w, wz or z or overlay with important fauna is an indication of high species diversity).
- Presence of walking and cycling paths: indicate whether the area is/will be accessible via (signposted) paths (walking, cycling, equestrian). If only part of the area is accessible via signposted paths, indicate what percentage of the area.
- Adjacent environment: by adjacent environment we mean the land use to which the nature reserve to be developed borders. If one of the possible types is strongly predominant, enter 100% there and 0% for the rest. If the nature reserve borders several types, none of which are dominant, indicate the share of the types in the total environment. Example: for an area with a circumference of 5 km that is bordered by 1.5 km of agriculture, 1.5 km of residential area and 2 km of nature, enter 30% for agriculture, 30% for built-up area and 40% for nature and 0% in an industrial environment. The sum must be 100%. The tool calculates this based on the land use map.
- List of sectors in a radius of 50 km around the study area (bird's eye distance between the center of the area and the center of the sector may not exceed 50 km) (the web tool calculates this automatically).
Substantiation of the function
The willingness to pay for the conversion of cropland/meadow (which in the survey was assumed to have no natural value and not be accessible) to a nature reserve was questioned in a large-scale survey in 2009 in which a choice experiment was conducted. For more details about the survey and the results, we refer to Liekens et al. 2009. The literature teaches us that the presence of substitutes, in other words the presence of existing nature in the vicinity, influences the willingness to pay for additional nature. This clearly applies to the use value of nature, for example for recreation. The more nature is available for recreation, the less willing there is to pay for additional nature. For example, someone who is surrounded by forests will relatively speaking be willing to pay less for an additional forest than someone who has no forest in their immediate vicinity. Someone will also have a certain willingness to pay for one additional forest, but this will probably be lower for a second additional forest. How much lower is not so clear. If you want to apply the function for different areas, you quickly run into budget limitations. It is less clear to what extent and in what way this applies to non-use value such as transfer value. We found no statistically significant indicator to include these effects in the function. Furthermore, the results show that people have a very high willingness to pay per hectare for a small area, but that this willingness to pay per hectare quickly drops as the area increases.
To take the above arguments into account, we developed a pragmatic approach based on the information people have given us about their willingness to pay more for nature with certain characteristics (depending on the type of nature, degree of accessibility, environment, species diversity), and the fact that the results show that people are willing to pay €0.05 extra per additional hectare, regardless of the characteristics of the area.
Function 1 is scaled in such a way that if the function is completed for a theoretical area of 1 ha, with average values for the determining parameters (e.g. for one sixth forest, one sixth grassland, etc.) the area is valued at €0.05 per household (hh) per year (for an average household). The value for a more attractive area (a forest, with high species diversity, with walking and cycling paths and next to a nature reserve) is then estimated at €0.0708/hh.y. The value of an average household for one hectare of less attractive area (grassland with low biodiversity, not accessible and next to an industrial area) is then estimated at €0.0276/hh.y. In this way, the amenity and transfer value of the most valuable nature reserve (from this group of values) is estimated to be approximately 2.7 times higher than the least valuable.
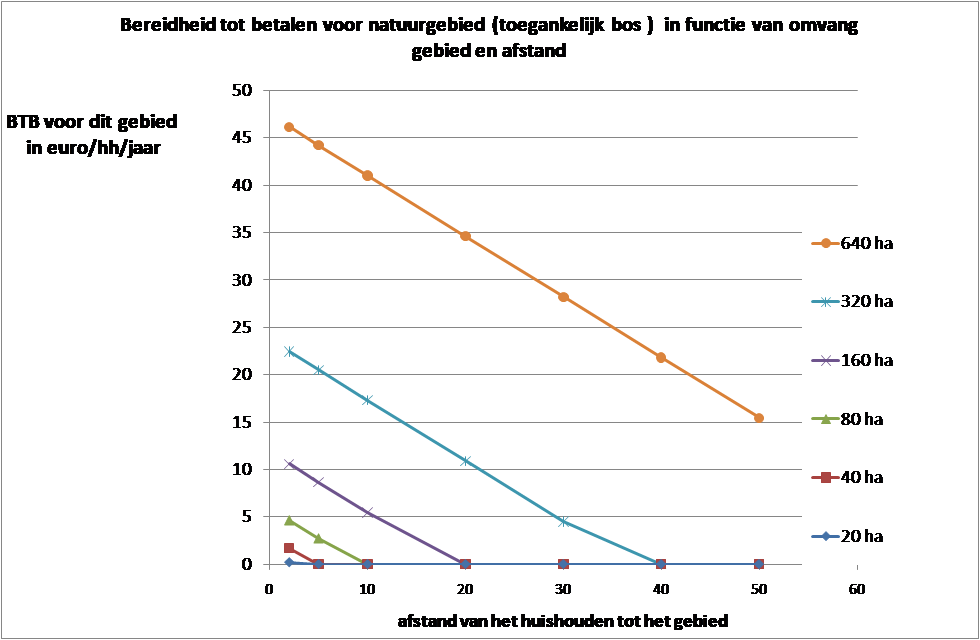
An important discussion that has a major impact on the value is determining to which households willingness to pay applies. Depending on the distance, we look at where there is still a positive willingness to pay for the changes in the area. This distance is limited to a maximum of 50 km within the limits of the survey. The BTB for additional nature decreases depending on the distance and size of the area. On average, the BTB decreases by €0.63 per kilometer distance between place of residence and area compared to the calculated willingness to pay as described in the above paragraph, multiplied by the number of hectares. The figure below illustrates how the distance decay for one area with certain characteristics (an accessible forest with high species diversity) influences the willingness to pay for different areas of the area. The red line illustrates that for an area of 40 ha, the BTB drops to 0 from a distance of approximately 5 km (so only households within a radius of 5 km are included in the calculation). For an area that has the same characteristics but is 320 ha in size, the BTB expires at a distance of 38 km. Only for areas of more than 500 ha do we estimate that there is still a positive BTB at a distance of 50 km. This approach is consistent with the knowledge of recreational use value of nature, where smaller areas only have a local importance, while larger areas have a supra-local importance.
figure: illustration of the impact of distance decay on willingness to pay for an accessible forest
Assumptions
- In the original survey, respondents had the choice of one type of ecosystem. In reality, an area will often consist of different ecosystems. The possible added value of variation in an area is not taken into account.
- Pioneer vegetation is distinguished separately in this function, but does not occur as standard for land use and vegetation types. Pioneer vegetation grows on bare soil. Sparse vegetation is found, sometimes with a number of rare plants, flowers and insects. These places are breeding grounds for various birds. The soil must be cleared occasionally, otherwise the area will evolve into grassland and then into scrub and finally forest. This land use is included under 'Sparsely vegetated land'.
- Seacoast dunes did not appear in the original survey. If the function is used for this purpose, the uncertainty in the outcome increases. It is now included in 'sparsely vegetated land'.
- If we use this function to value a change in ecosystems within a nature reserve, we make the assumption that both areas are constructed on cropland/meadow. The results of both calculations are then subtracted from each other.
Functions to use
Low estimate:
BTB= (0.034 x sparsely vegetated land + 0.025 x flat plains and marshes + 0.025 x grasslands and tall herbs + 0.045 x forests + 0.037 x wetlands, rivers and lakes + 0.037 x heathland and shrubs + 0.0072 x species richness – 0.00013 x if high species diversity x age + 0.0098 x presence of walking and cycling paths + 0.0018 x natural environment + 0.0016 x residential environment – 0.0051 x industrial environment + 0.0000024 x income – 0.014 x % women + 0.029 x % membership) x size in hectares - 0.68 x distance in km
The BTB is greater than or equal to zero (it cannot be negative).
High estimate:
BTB= (0.042 x sparsely vegetated land + 0.033 x flat plains and marshes + 0.033 x grasslands and tall herbs + 0.053 x forests + 0.046 000085 x if high species diversity x age + 0.011 x presence of walking and cycling paths + 0.0032 x natural environment + 0.0031 x residential environment – 0.0040 x industrial environment + 0.0000047 x income – 0.0093 x % women + 0.038 x % membership) x size in hectares - 0.57 x distance in km
And BTB is greater than or equal to zero.
required input data
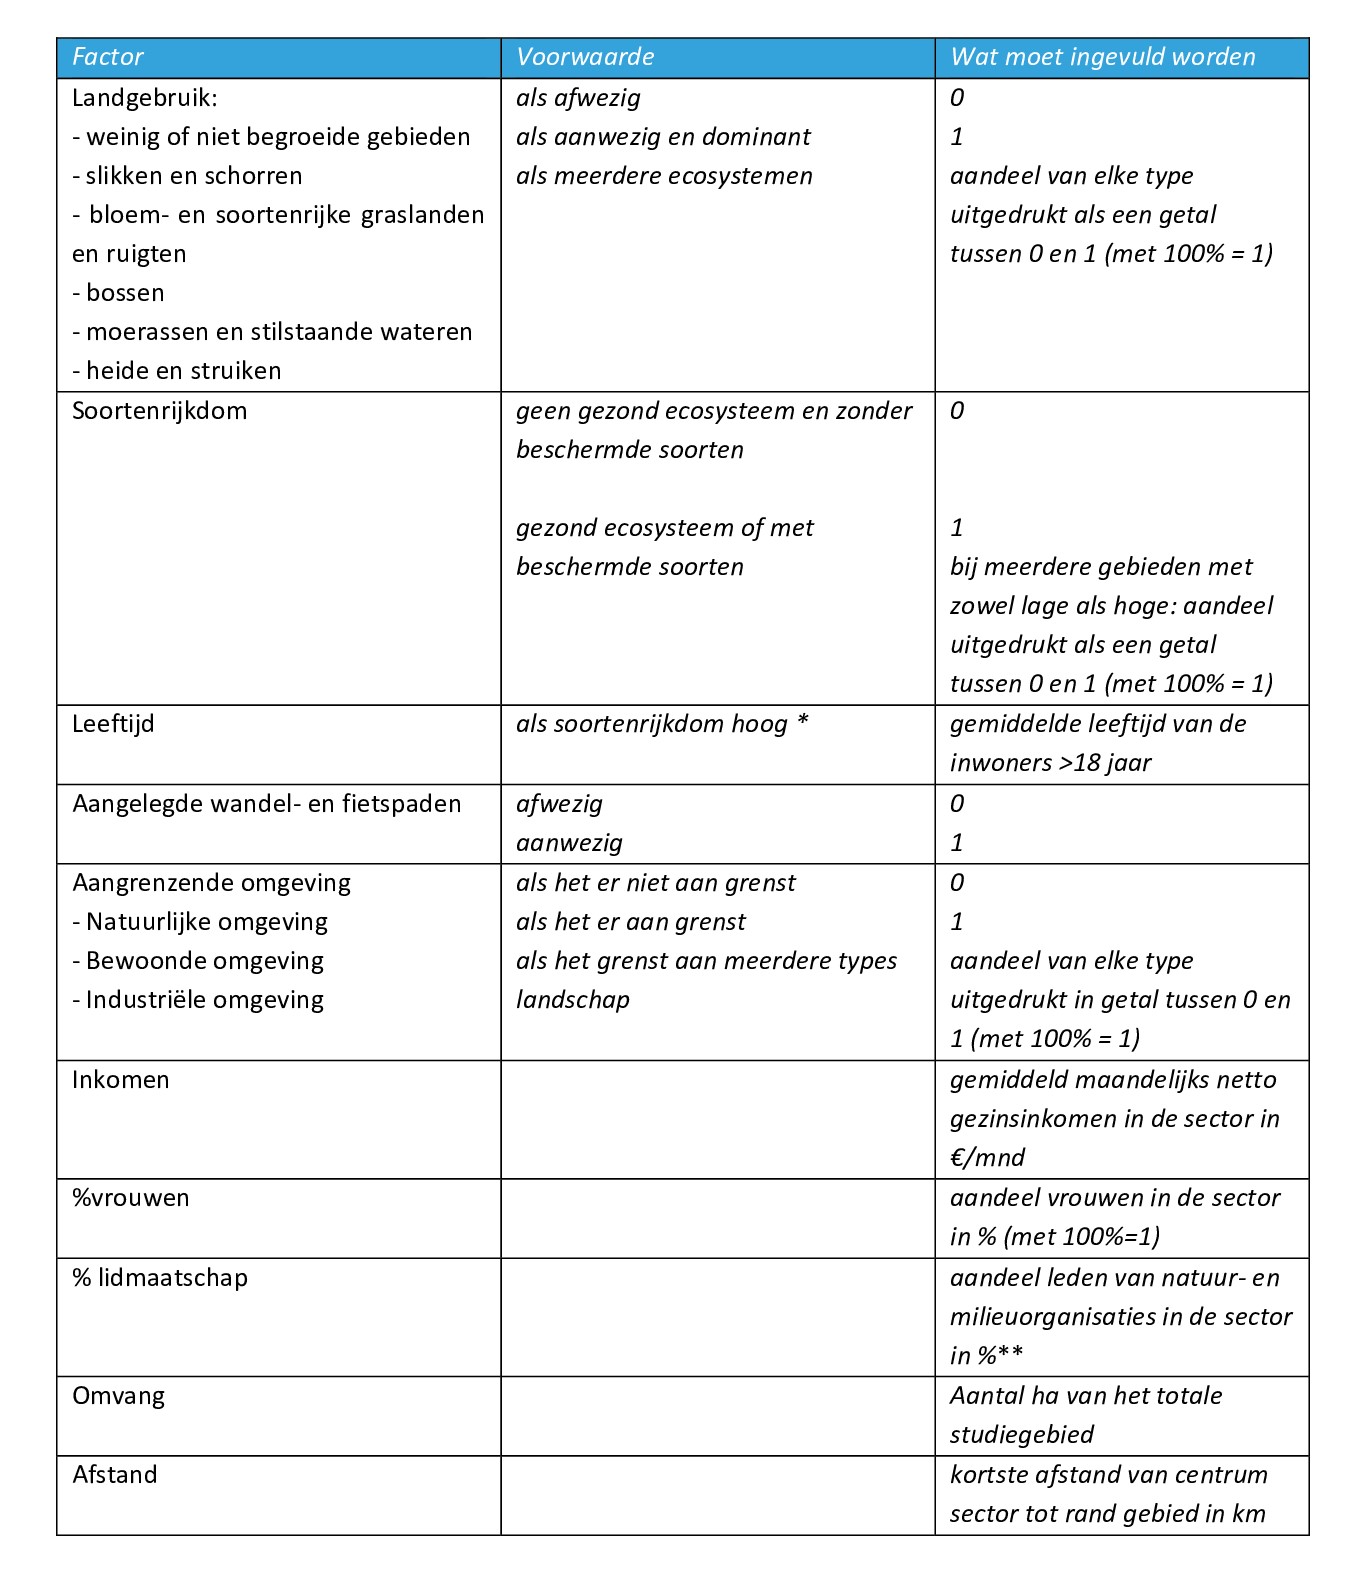
* is not relevant with low species richness
** or approximate figure for Flanders: 8% in 2010
So the following data should be determined:
Ecosystem: You can determine the ecosystem using the BWK code - enter a 1 after the relevant parameter and set the other to zero. If the area consists of multiple ecosystems, you must determine which ecosystem is most appropriate. If large parts of the area (at least 10 ha) are different, you can enter the ratio for each ecosystem instead of 1. For example: 50 ha area, of which 25 ha flat plains and marshes (estuarine) and 25 ha wet forests. Then enter ½ behind the forest parameter and ½ behind the flat plains and marshes parameter. Set the other parameters to zero.
Species richness: enter 1 if the area has a healthy ecosystem or if it contains protected species in Flanders (e.g. red list species). If neither of these conditions apply, enter 0. In the case of multiple ecosystems where some have a high species richness and others do not: enter the share of high species richness compared to the total size after the parameter. For example, if 100 ha of the 200 ha area has a high species richness, then enter 0.5.
Presence of paths: if there are accessible paths (walking, cycling, equestrian) in the area, enter 1. If there are no paths in the area (even though it is possible to access them), enter 0.
Adjacent environment: to which type of environment does the natural landscape predominantly border (or will it border):
adjacent to buildings (residential zone): set the parameter residential environment to 1, the parameters industrial environment and natural environment to 0.
adjacent to industry: set the industrial environment parameter to 1, the residential environment and natural environment parameters to 0.
adjacent to existing nature: set the natural environment parameter to 1, the industrial environment and residential environment parameters to 0.
adjacent to agricultural area: this is the starting level of the function, so set the parameters industrial environment, residential environment and natural environment to 0.
If the landscape borders several types other than agriculture, fill in the relevant parameters proportionately. For example, if an area borders both buildings and industry, enter ½ for residential area and ½ for industrial area.
Size: determine the total size of the study area in hectares.
Distance to statistical sectors § and parameters per sector: Complete the valuation function per sector with the above parameters and the following specific parameters:
- distance: the distance from the center of the sector to the edge of the area in km (bird's eye view or better yet by road, depending on the GIS tools at your disposal)
- percentage of women (e.g. 50% = enter 0.5)
- average monthly disposable family income
- average adult age (from 18 years): age does not play a role if the species richness is low, in which case this does not need to be looked up because then this parameter is set to 0. Average for Flanders: 48 years
- percentage of households that are members of a nature or environmental organization: for Flanders this is an average of 6%.
This data can be found on the website of the Study Service of the Flemish Government (http://www4.vlaanderen.be) or on that of the FPS Economy (http://statbel.fgov.be).
For the percentage of membership, it is best to base yourself on the socio-cultural shifts survey that the Study Service of the Flemish Government carries out annually. In recent years, the number of members of nature and environmental organizations has been around 6%. Based on a communication from Natuurpunt, it can be assumed that this is divided equally among the municipalities.
Multiply the values per sector by the number of households in this sector. The number of households can be found on the website of the study service of the Flemish government.
You can also use the Excel table in the Nature Value Explorer, which lists all the required figures for 2021. Background documents can be found at https://natuurwaardeverkenner.be/.
Adding all these values gives you the total annual willingness to pay for the scenario. This method not only takes into account the population characteristics that influence willingness to pay, but also the distance of households to the area. This is essential as the willingness to pay decreases as the distance to the area increases. Instead of doing the calculation for all sectors within a 50 km radius, you can calculate the distance at which the function falls to zero (see end of example). You then calculate the function for all sectors within this distance. You calculate this distance by entering the averages for Flanders into the function and mathematically solving the function for a distance at which the function is equal to 0.
Of course, you can also let the tool do the research and calculation work. The web tool automatically searches this data for all statistical sectors within a radius of 50 km and then calculates the functions.
§ A statistical sector is the smallest basic territorial unit created by the Belgian National Statistical Institute for which socio-economic statistics are still being compiled. In 2007, there were 19,781 statistical sectors in Belgium.
An example
For the example, we refer to the Dutch version of the manual.