Reducing noise pollution
Description
Annoyance is the most experienced problem as a result of noise pollution. In Flanders, which is characterized by its high density of habitation and activity, noise pollution is the most important disturbance to the living environment (Jacobs et al. 2010). Noise pollution from traffic and transport appears to be the most important source of annoyance. In this manual we limit ourselves to noise from traffic.
Placing a noise buffer between traffic and residents is a common measure to prevent nuisance. Natural vegetation structures can also act as a buffer. Forests in particular play a role in this. That is why we have specifically focused on forests along busy roads in the Nature Value Explorer.
Depending on the hardness and compactness of the soil, the soil can also absorb sound to varying degrees. This has been included in the valuation in a simplified manner.
Vegetation can effectively limit noise levels, but can also have a positive psychological effect. This audio-visual interaction can be quite strong in human perception (Watts, 1999; Van Renterghem, 2015; Yang, 2011). Greenery and vegetation appear to be positive here. A person exposed to the same (physical) noise level will feel less bothered when there is actually a view of vegetation (non-visible neighborhood greenery is probably insufficient). Good figures on this are not available, although there has recently been renewed interest in this effect. Based on a recent master's thesis at Ghent University (Acoustics Research Group), the equivalent noise reduction appears to be up to a maximum of 3 dBA (via listening tests in the laboratory). A conservative estimate of 1.5 dBA was therefore applied in the current list, and only for standing vegetation. The effect of a view on, for example, a (grass) lawn is not known.
Attention
This ecosystem service is currently not included in the Nature Value Explorer tool.
Required information:
First determine whether the study area falls within the noise contours of the noise maps. http://www.lne.be/themas/hinder-en-risicos/geluidshinder/Geluidskaarten If there is indeed a problem of noise pollution, determine the following elements:
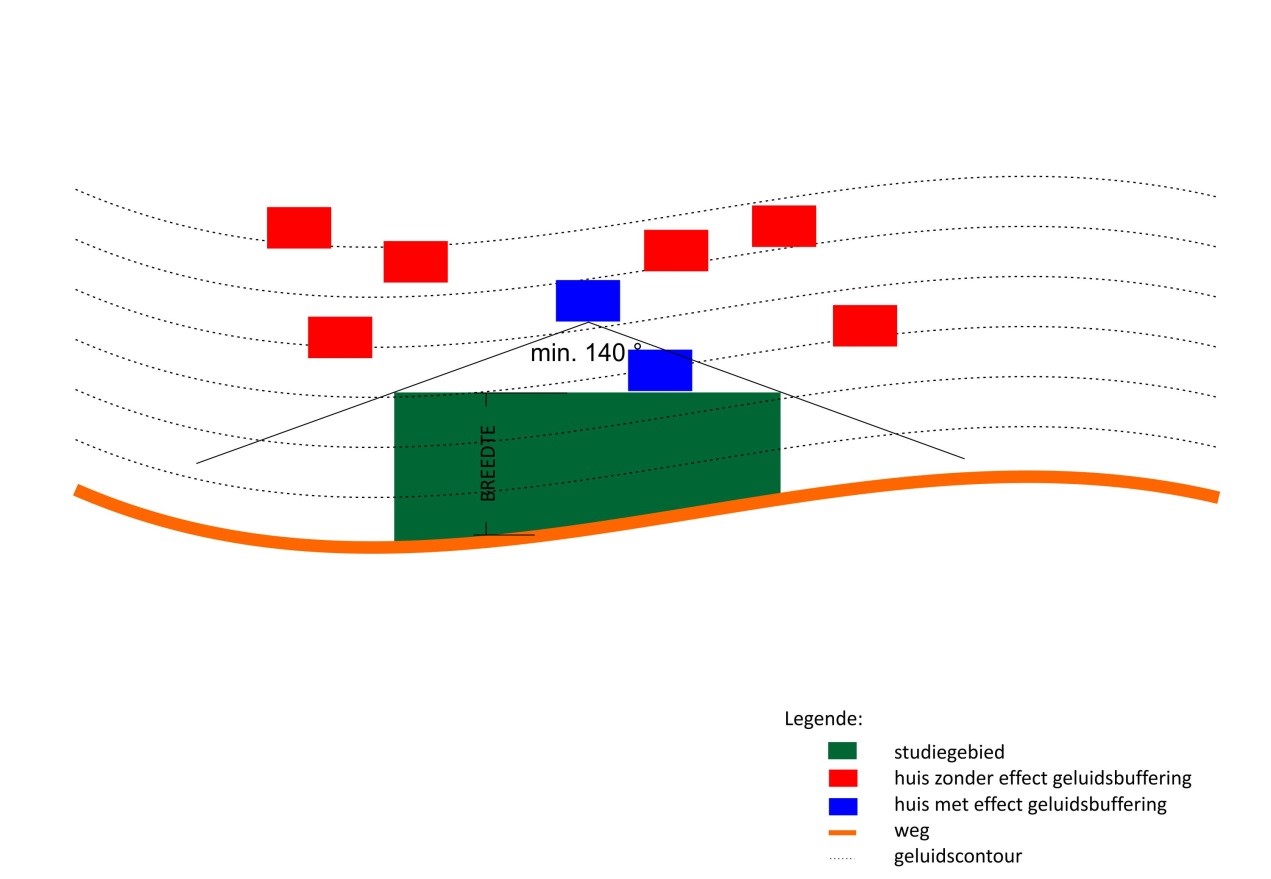
- Number of (potentially) affected homes: determine the number of homes that lie within the noise contours where the study area may serve as a buffer between the noise source and the home. Only homes that form at least an angle of 140° with the study area in relation to the noise source benefit from noise buffering (rule of thumb for noise barriers) (see illustration)
- Number of dB(A) at homes in the current situation: self-measured noise level at homes or noise level determined via noise maps http://www.lne.be/themas/hinder-en-risicos/geluidshinder/Geluidskaarten. You need the lower and upper limits of the noise contours on this map.
- Area width: width of the study area between the noise source (road) and the house measured in m perpendicular to the road. If the distance varies, take the average distance. For example, if only half of this width changes vegetation type, it is recommended to only enter the width of the changing land use.
- Vegetation type of this intermediate area both in the current situation and in the future situation: 0= urban land use and rivers and stagnant waters; 1= cropland and meadow, grassland and tall herbs, coastal habitats and estuaries, heathland and inland dunes, wetlands; 2= forests
Qualitative appreciation
The focus of the noise sources is mainly on busy connecting roads (rail and road traffic), for which noise maps from the LNE department are available. We therefore do not take the noise buffering effect for point sources into account here.
Hard soils (e.g. concrete and asphalt) and water (type 0) reflect strongly and amplify sound. We give these types a score -1. Semi-soft soils such as grassland, loose soil and cropland have greater absorption (type 1). For an area of 200 m wide (the maximum effect of vegetation on noise reduction is then achieved), these areas receive a score of 3. For areas narrower than 200 m, the score will decrease proportionally. We assume here only three types of soil (hard, semi-soft and forest soil). In reality, there is more distinction between different types of soil. For example, heathland also has a very soft soil. The very soft bottoms enhance the absorbing effect in the mid frequencies. In the very low frequencies (up to 125Hz) there is no effect compared to hard bottoms.
In addition to a soil effect, forests also have an additional sound-absorbing effect through a number of processes. For a maximum width of 200 m, type 2 receives a score of 10. The score decreases proportionally with the reduction in width.
Quantitative valuation
The effect of the bottom depends on frequency and weather and is not directly proportional to distance. Based on formulas from ISO9613-2:1196 for noise calculation, the impact of different types of soil on noise was calculated.
There are major differences in the extent to which different types of vegetation dampen sound. This is partly due to the great diversity in vegetation, such as deciduous or coniferous trees; the size of the trees; the amount of foliage on the trunk and the season.
The acoustic effect of forests is only significant at a width of at least 100 m (observable by humans) and also has a saturation point (this is around 200 to 300 m depending on the effects that are included) (ISO9613-2:1196). Reported figures for noise reduction are between 3 dB(A) and 16 dB(A) for 100 to 200 m of forest (Huisman, 1990; De France et al. 2002). The results are seasonal (the sound-dampening effect of a deciduous forest in summer is higher). However, the chosen estimates are a conservative estimate of the effect (higher values reported in some foreign studies) and can therefore be used approximately as an annual average.
The total impact on the noise level is determined based on the existing noise level. This can be deduced from the noise map of LNE (http://www.lne.be/themas/hinder-en-risks/hondenhinder/Geluidskaart). For the low estimate we use the lower limit of the class of the existing background level in combination with the low estimate for the effect of vegetation (3 dB(A) per 100m). For the high estimate we use the upper limit of the class of the existing background level in combination with the high estimate for the effect of vegetation (8 dB(A) per 100m with a maximum effect up to 200m).
If you use figures from the noise maps to measure the noise effect of felling a forest, you should start from the dB(A) indicated on the map minus the calculated impact of a forest on the noise level as the current situation. The figures on the noise map then represent the future situation (an increase in sound pressure level) because the noise maps do not take existing vegetation into account, but they do take the soil effect into account.
Monetary valuation
To value noise pollution, we build on studies with the hedonic price method. These studies show that the value of houses decreases as noise pollution increases (den Boer et al. 2008; Resource Analysis 2006). The additional price the buyer is willing to pay for a house in a quieter area is an indicator of the additional monetary value he will receive as a result.
We work with the average house price in Flanders. In the Flemish Region, the median price of 240,000 euros was paid for a residential house in 2019 (statbel 2019). We convert this figure into an annual effect. If we assume a discount rate of 4% and a time horizon of 50 years, the average value for a home is €11,172/year.
Formula
average value of a home per year x % reduction calculated x number of homes.
Assumptions
- Only figures for road traffic noise are included. For lower and higher frequencies the numbers may be lower or higher respectively. The figures in the manual are only an average approximation of reality. For example, little or no account is taken of the local effect of reflections, wind and atmospheric effects, types of forest and soil structure. If noise turns out to be important in the whole of ecosystem services, we think it would be appropriate to measure the current situation on site and then model adjustments (by noise experts).
- Calculations are done with the depreciation of homes for noise pollution during the day. We calculate with the average house price for Flanders.
- To calculate an annual benefit, we assume a discount rate of 4% and a time horizon of 50 years.
When creating a new forest, we assume that after 10 years a sufficiently dense forest will be created to be able to provide this service. The calculation in the Nature Value Explorer acts as if there were a forest immediately. In principle, only the damping effect of a soft soil (type 1) applies for the first 10 years. This must be taken into account, for example in an SCBA.
Numbers to use
Table: qualitative assessment of noise at different useful widths
| Qualitative (score -1 to 10) | 50m | 100m | 150m | 200m |
|---|---|---|---|---|
| Vegetation type | ||||
| Urban, rivers and lakes (type 0) | -1 | -1 | -1 | -1 |
| Cropland, meadow, grassland and tall herbs, wet nature, sparsely vegetated land, heathland (type 1) | 2 | 3 | 3 | 3 |
| Forests (type 2) | 3 | 6 | 8 | 10 |
For a width greater than 200m, use the maximum score for the corresponding type.
Figures for dB(A) at the (potentially) affected homes from the legend noise contours noise map LNE

Table: quantitative evaluation: reduction in dB(A) per vegetation type on a hard soil (type 0) at different widths.
| dB(A) low value | 50m | 100m | 150m | 200m |
|---|---|---|---|---|
| Vegetation type | ||||
| 0 | -3 | -4.02 | -4.68 | -5.49 |
| 1 | 4 | 4 | 4.5 | 5 |
| 2 | 5.5 | 9 | 11 | 13 |
| dB(A) high value | 50m | 100m | 150m | 200m |
|---|---|---|---|---|
| Vegetation type | ||||
| 0 | -3 | -4.02 | -4.68 | -5.49 |
| 1 | 4 | 6 | 6.5 | 7 |
| 2 | 8 | 14 | 18.5 | 23 |
Table: monetary valuation: % depreciation of a home per dB(A) increase in noise
| Exposure (dBA) | Minimum (%/dBA) | Maximum (%/dBA) |
|---|---|---|
| 50 – 54 | 0 | 0 |
| 55 – 69 | 0.6 | 0.9 |
| > =70 | 1.5 | 1.9 |
Source: Franck et al. 2013, 2015 NSDI: Noise Sensitivity Depreciation Index
The average value for a home in 2019 was €240,000 or €11,172/year.
Formula
average value of a home per year x % reduction calculated x number of homes.
Translation to an indicator
As an indicator we use the number of homes that experience less nuisance from noise.
An example
For the example, we refer to the Dutch version of the manual.
Detailed models/tools
Within the acoustics research group (UGent) there is extensive expertise regarding sound propagation in the outdoor environment and the design of noise-reducing solutions. Not only is there experience with classical prediction tools (such as those used in noise mapping), but calculation techniques have also been developed that allow detailed modeling to be carried out for specific cases, including natural solutions. So-called "full-wave" models are used for this. Detailed modeling can help to design a vegetation zone: e.g. stem diameter and evolution of the noise shielding over time, optimal planting patterns, depth and width of a vegetation zone, etc. In the context of natural solutions, modifications of the relief (e.g. verges, slopes in the landscape) and soil modifications are examined and optimized for their noise reduction. More complex interactions, such as the influence of vegetation on the local wind and temperature field (micro-climatology), and how this influences sound propagation, can be investigated.
Given the complexity of these models, calculations can only be performed on request. There is a cost associated with this. Contact person: Prof. Dr. ir. Timothy Van Renterghem, Acoustics Research Group, Department of Information Technology, Faculty of Engineering and Architecture, Ghent University. E-mail: timothy.van.renterghem@intec.ugent.be