Results
The tool now starts calculating. This may take a while for a large number of measures. You will now see several result pages.
You can view these per measure or for the entire area. Cultural services such as recreation, housing value and health effects are only calculated for the entire study area.
The report consists of 3 parts:
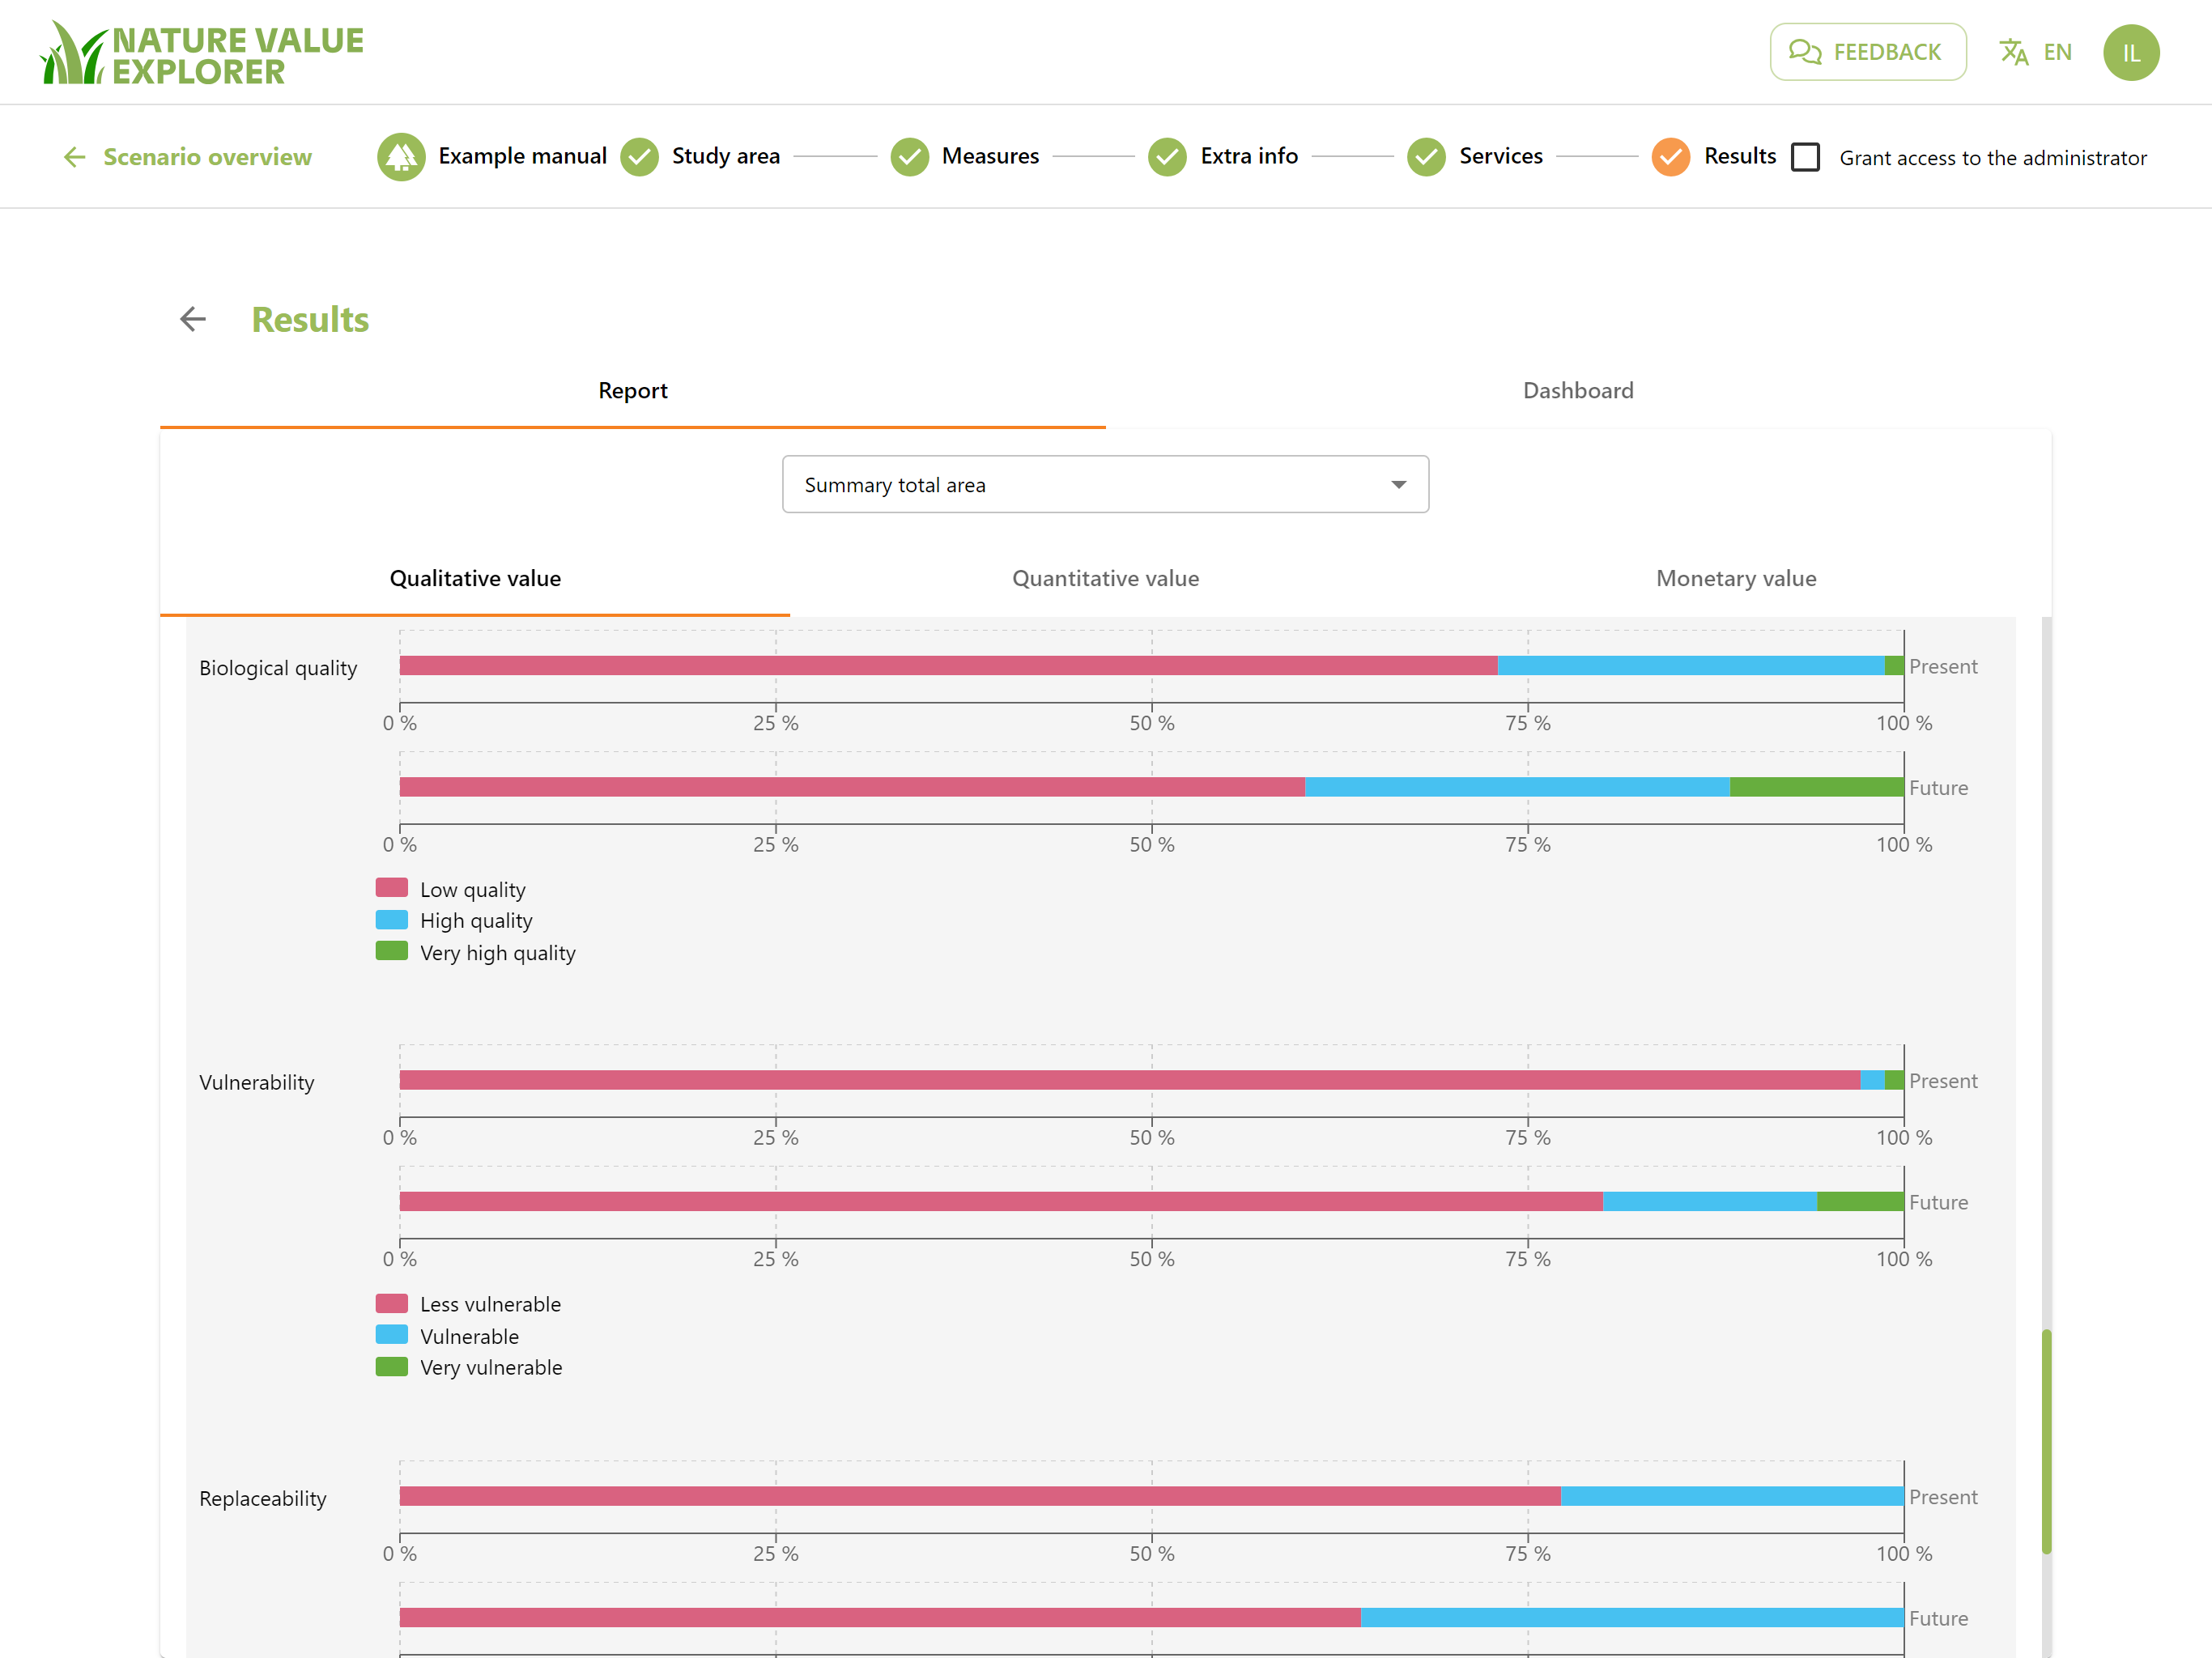
Qualitative valuation
The qualitative assessment provides a score for the current situation and the future situation for the extent to which the ecosystem service is provided by the area for each calculated ecosystem service. This score is based on data for Flanders. So if a certain area scores low for a service, this means that there are areas elsewhere in Flanders that score much better for this service. Important to know is that the score says nothing about the potential of the area to deliver the ecosystem service. For example the area can score 0 for the ecosystem service recreation because the area is unaccessible, but it might be a very attractive area for recreation.
In our example, there is not much wood production possible in the area. The function of infiltrating water is above average compared to Other areas in Flanders.
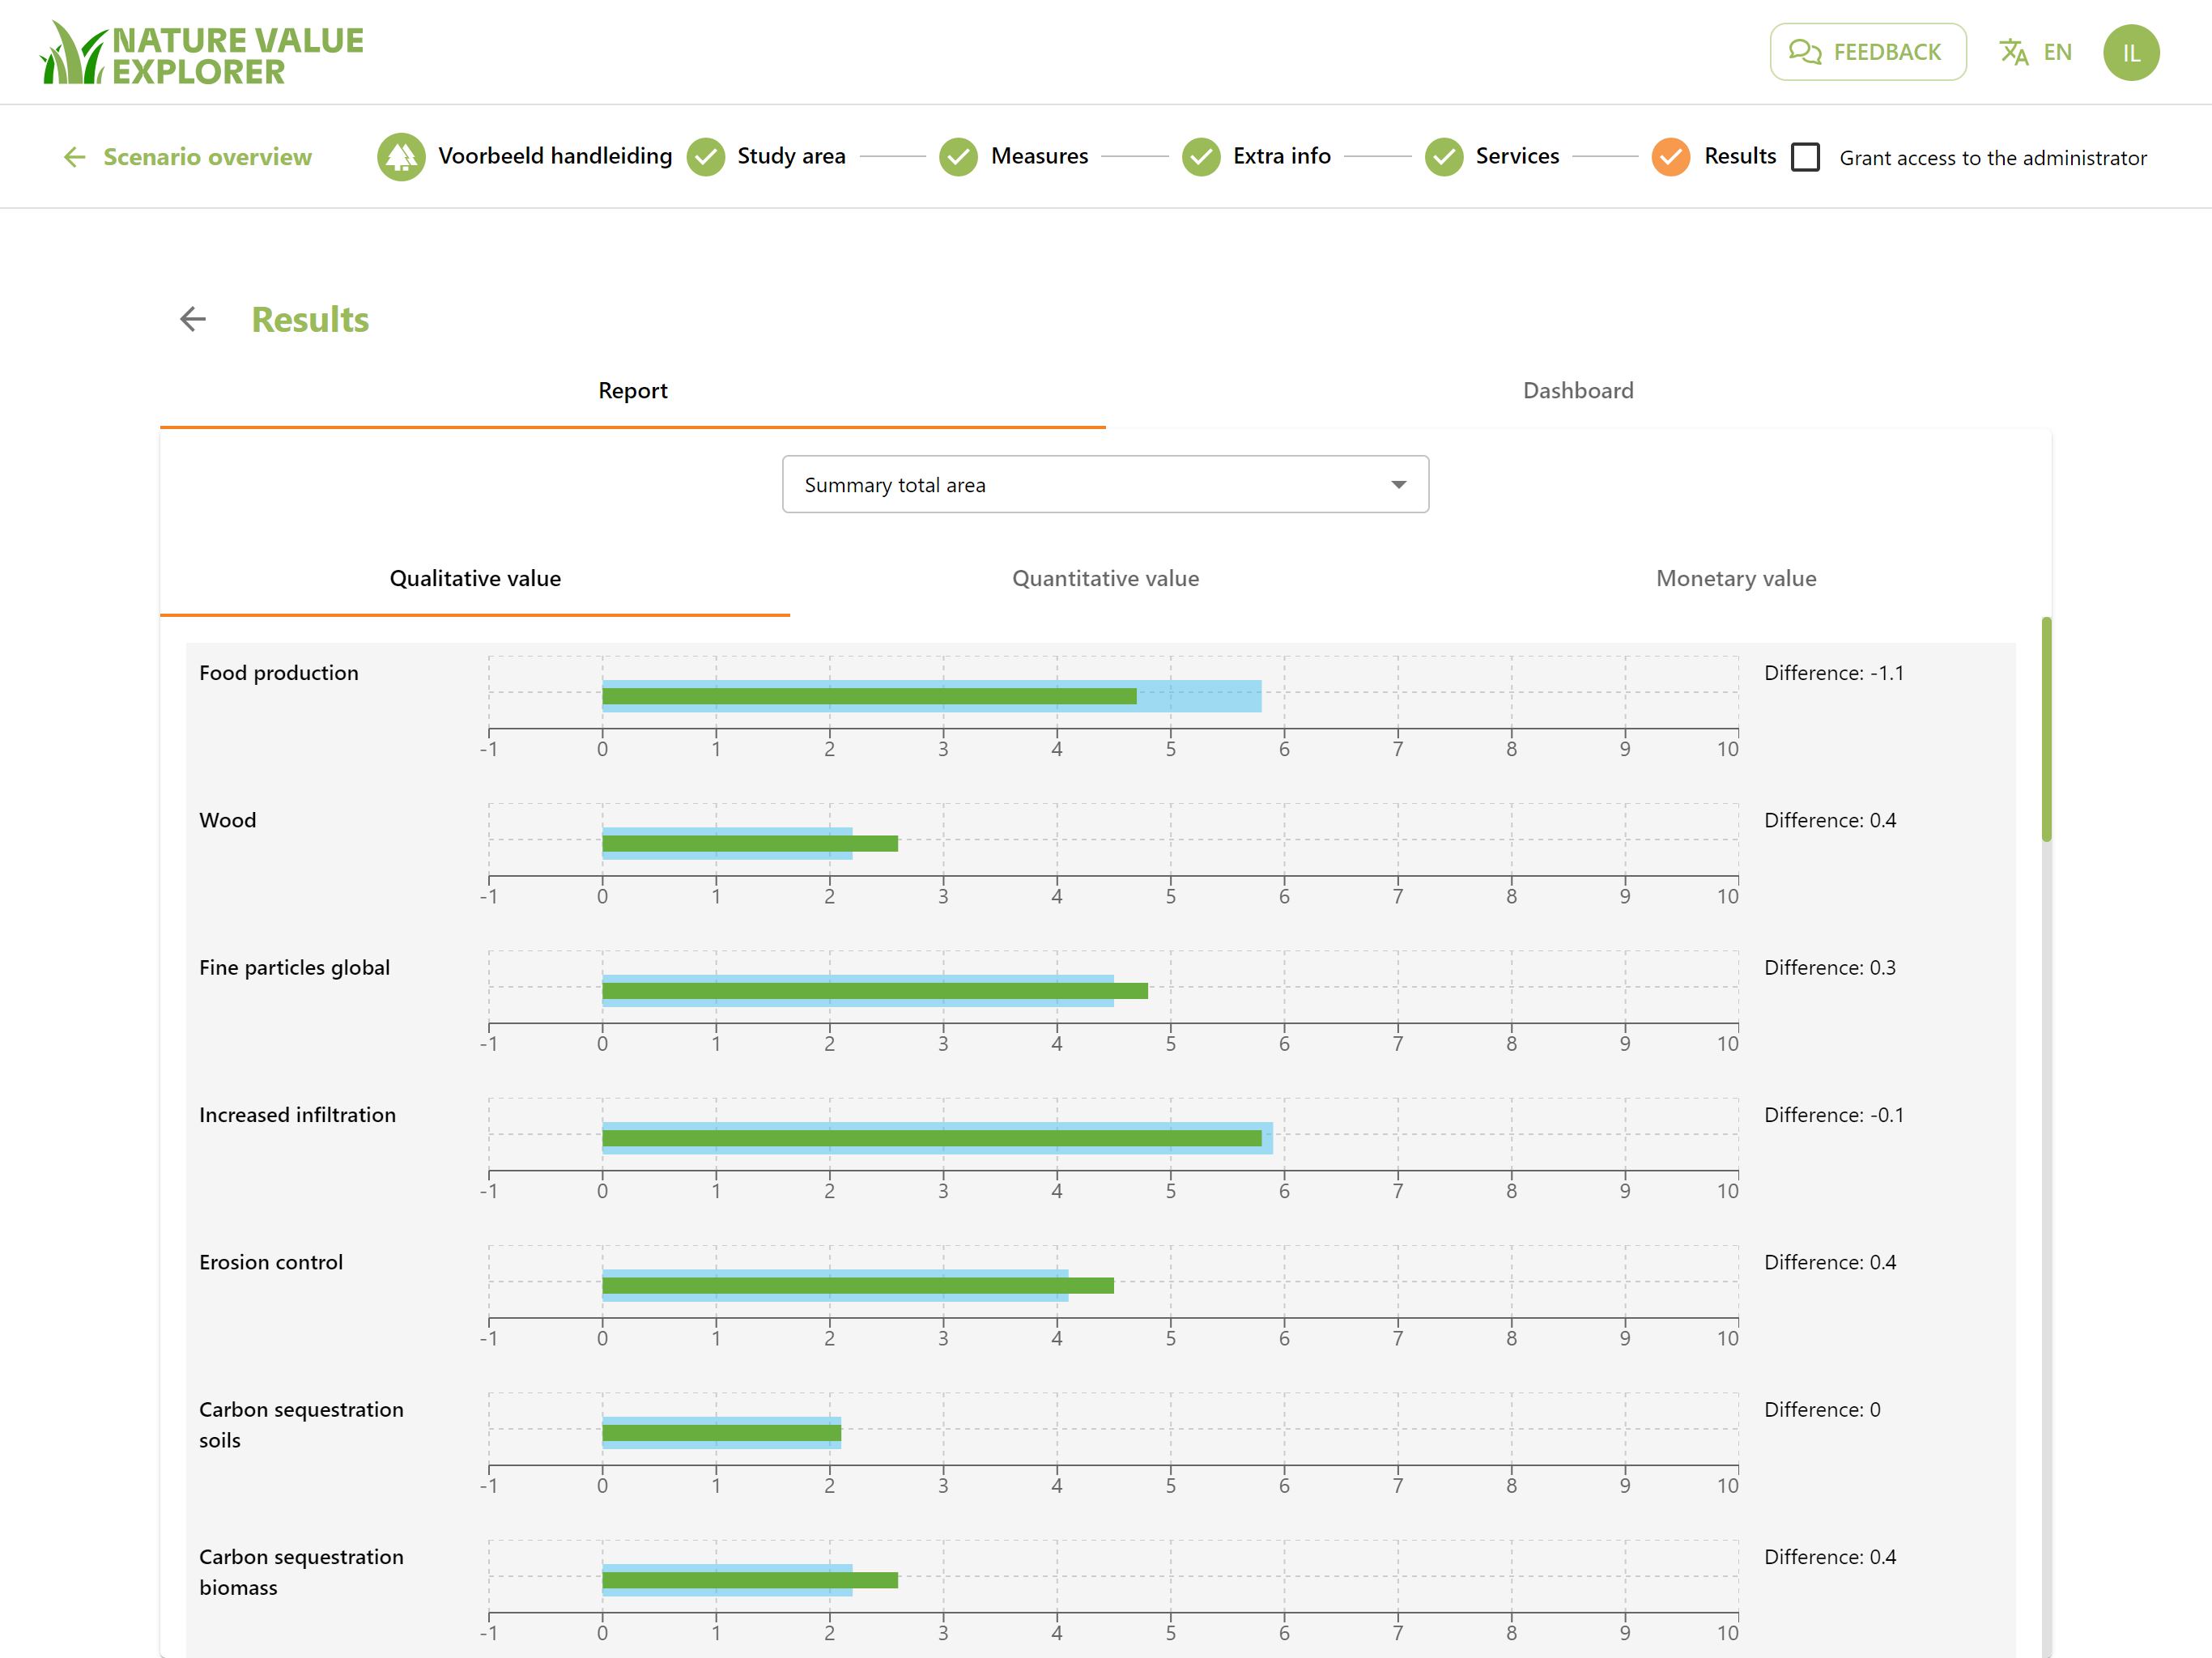
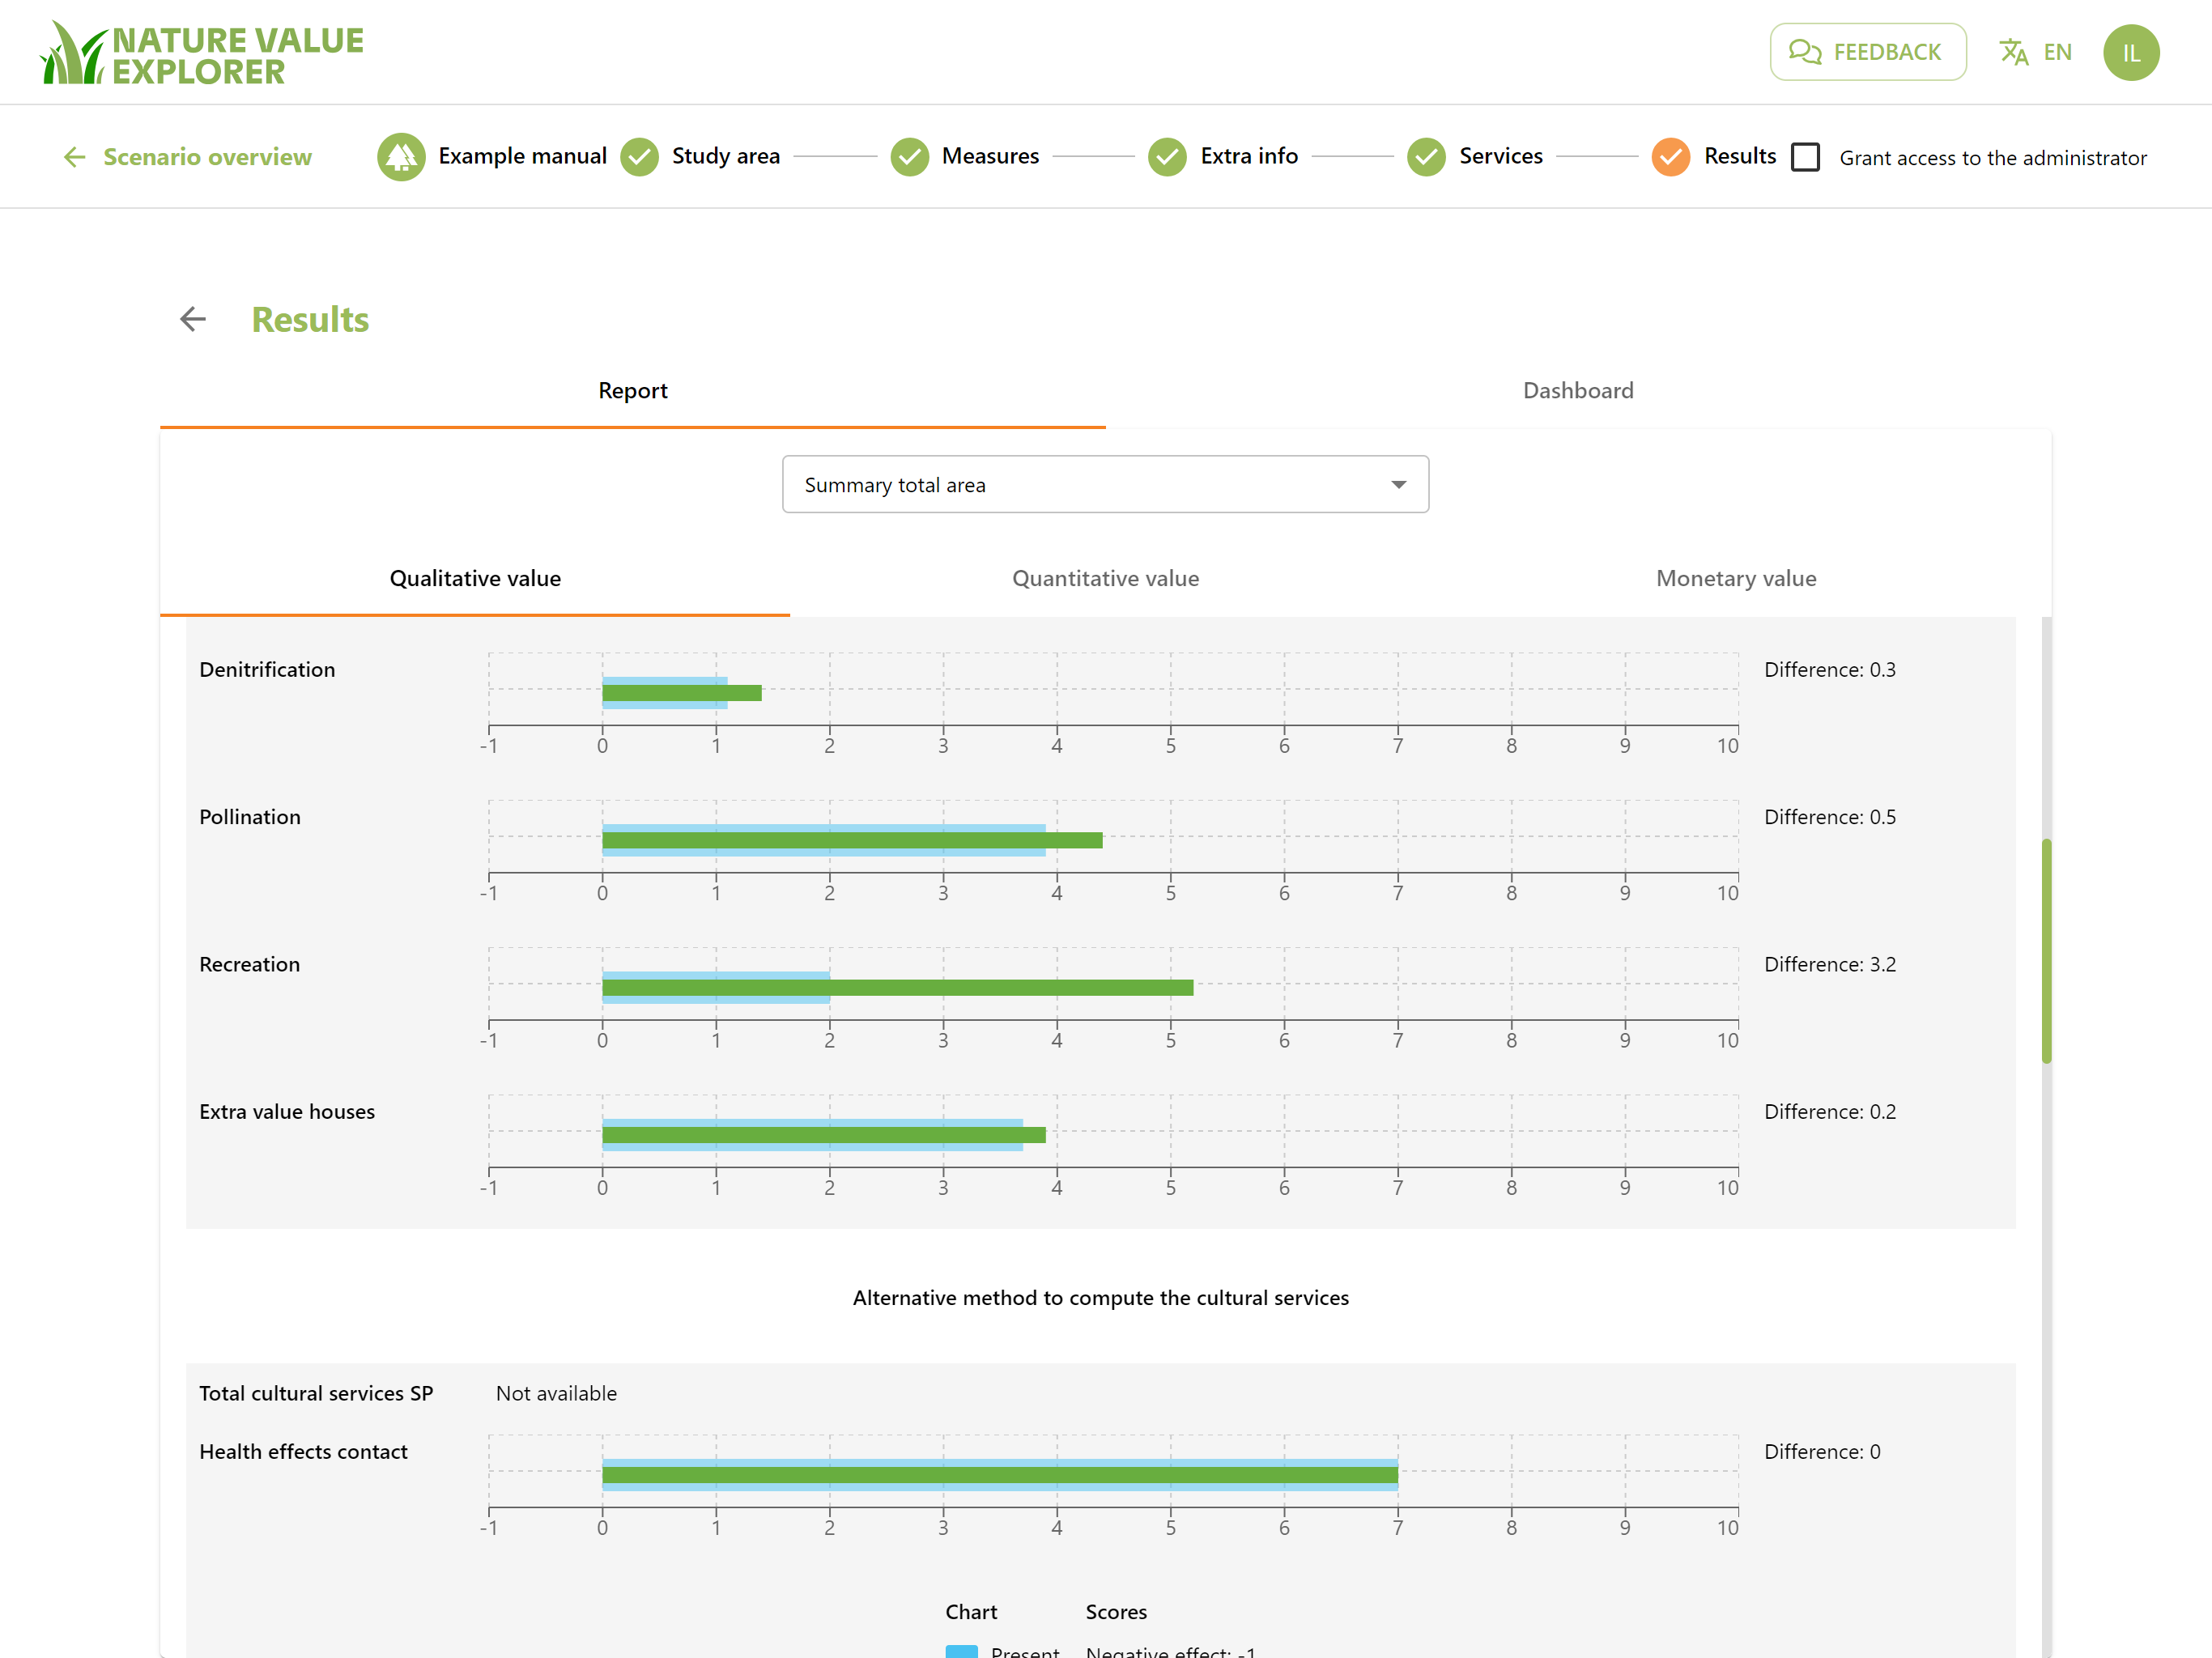
You can also compare the scenario (green) with the current situation (blue) or if you have calculated multiple scenarios with alternative designs.
For example, in our example, recreation will increase significantly because in our scenario signposted paths with benches are provided, in a previously inaccessible area. Food production, which is already well present in the area, will decrease slightly because some agricultural land is being afforested.
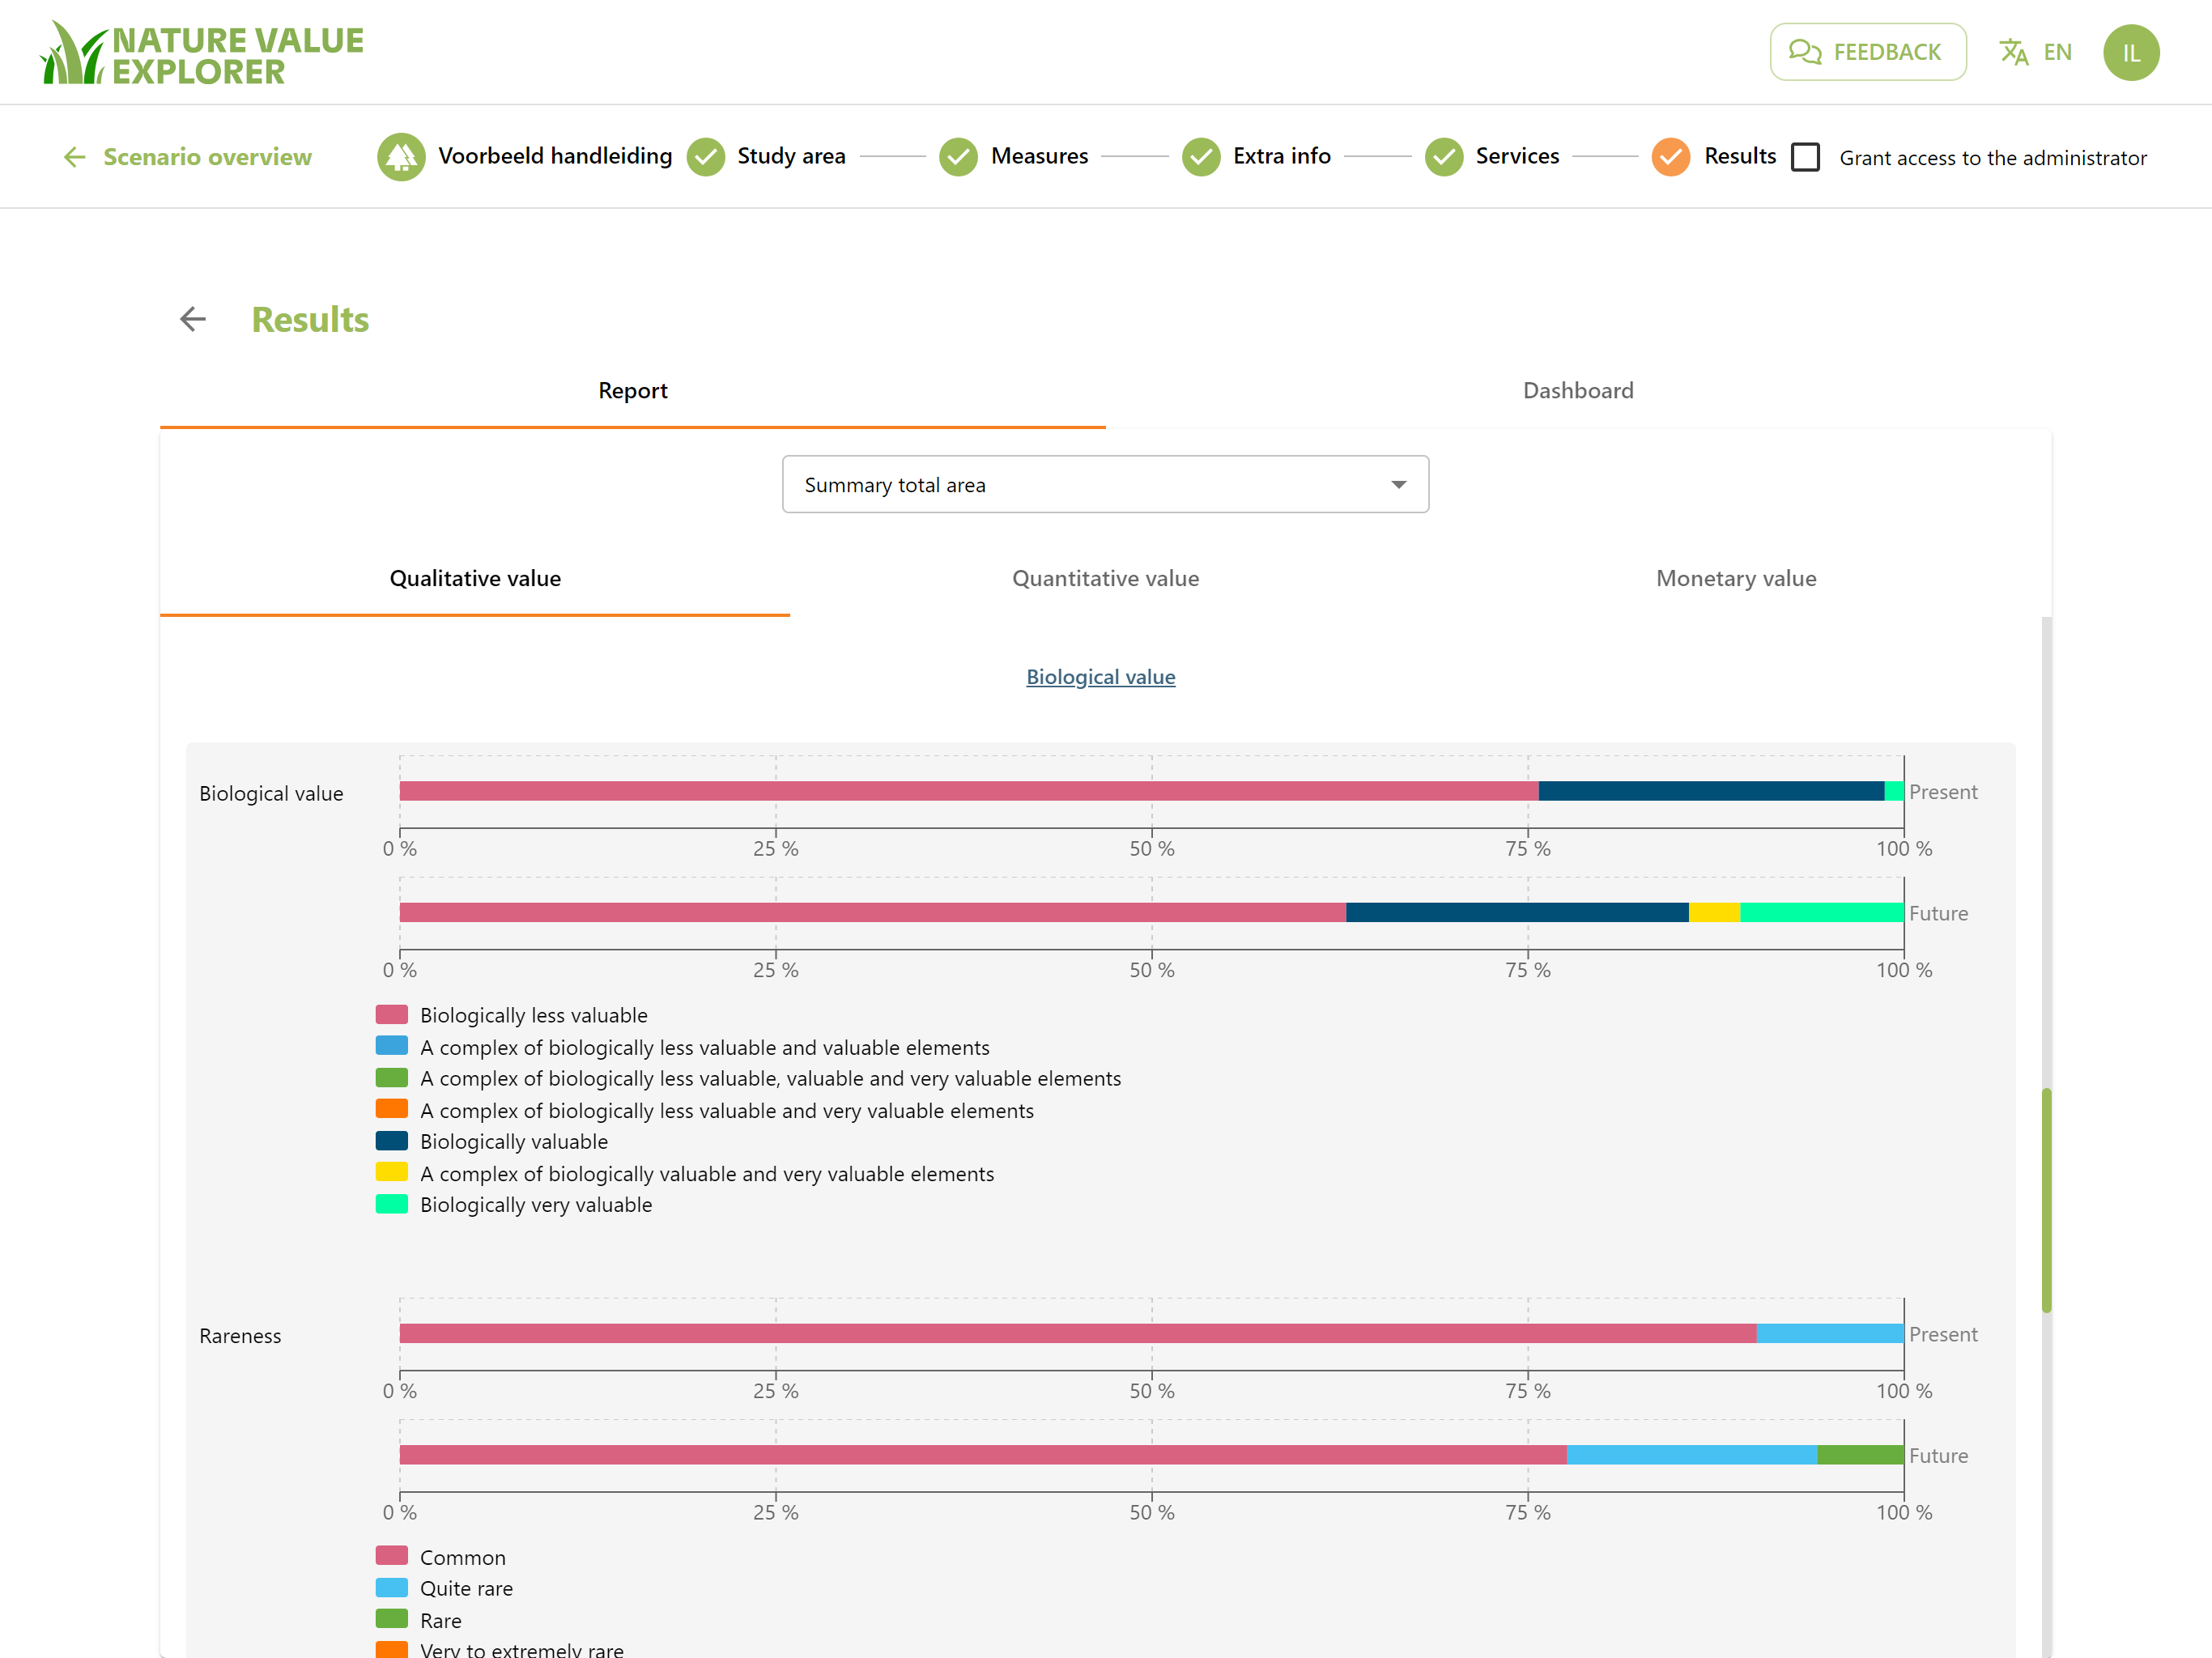
For some scenarios, land use will not change, but the quality of the ecosystems in the area will increase. Because the focus of stakeholders is sometimes too one-sided on the results from the tool, a simple method was included at the request of our users to also map the Biological value of the area. This is based on the valuation behind the Biological Valuation Map (BWK).
The scores indicate how the biological value changes with the interventions. The future value is estimated based on the desired ecosystems.
Quantitative valuation
The quantitative valuation calculates the quantity of a specific service provided on the basis of statistical functions. Depending on the service, this delivery is expressed in a different unit.
For example, the carbon storage service will be expressed in tons of C, the recreation service in the number of visits.
The figures indicate a certain order of magnitude but should certainly not be seen as absolute figures. This requires more extensive models. The main intention is to compare the different scenarios with each other. Different areas can also be compared with each other.
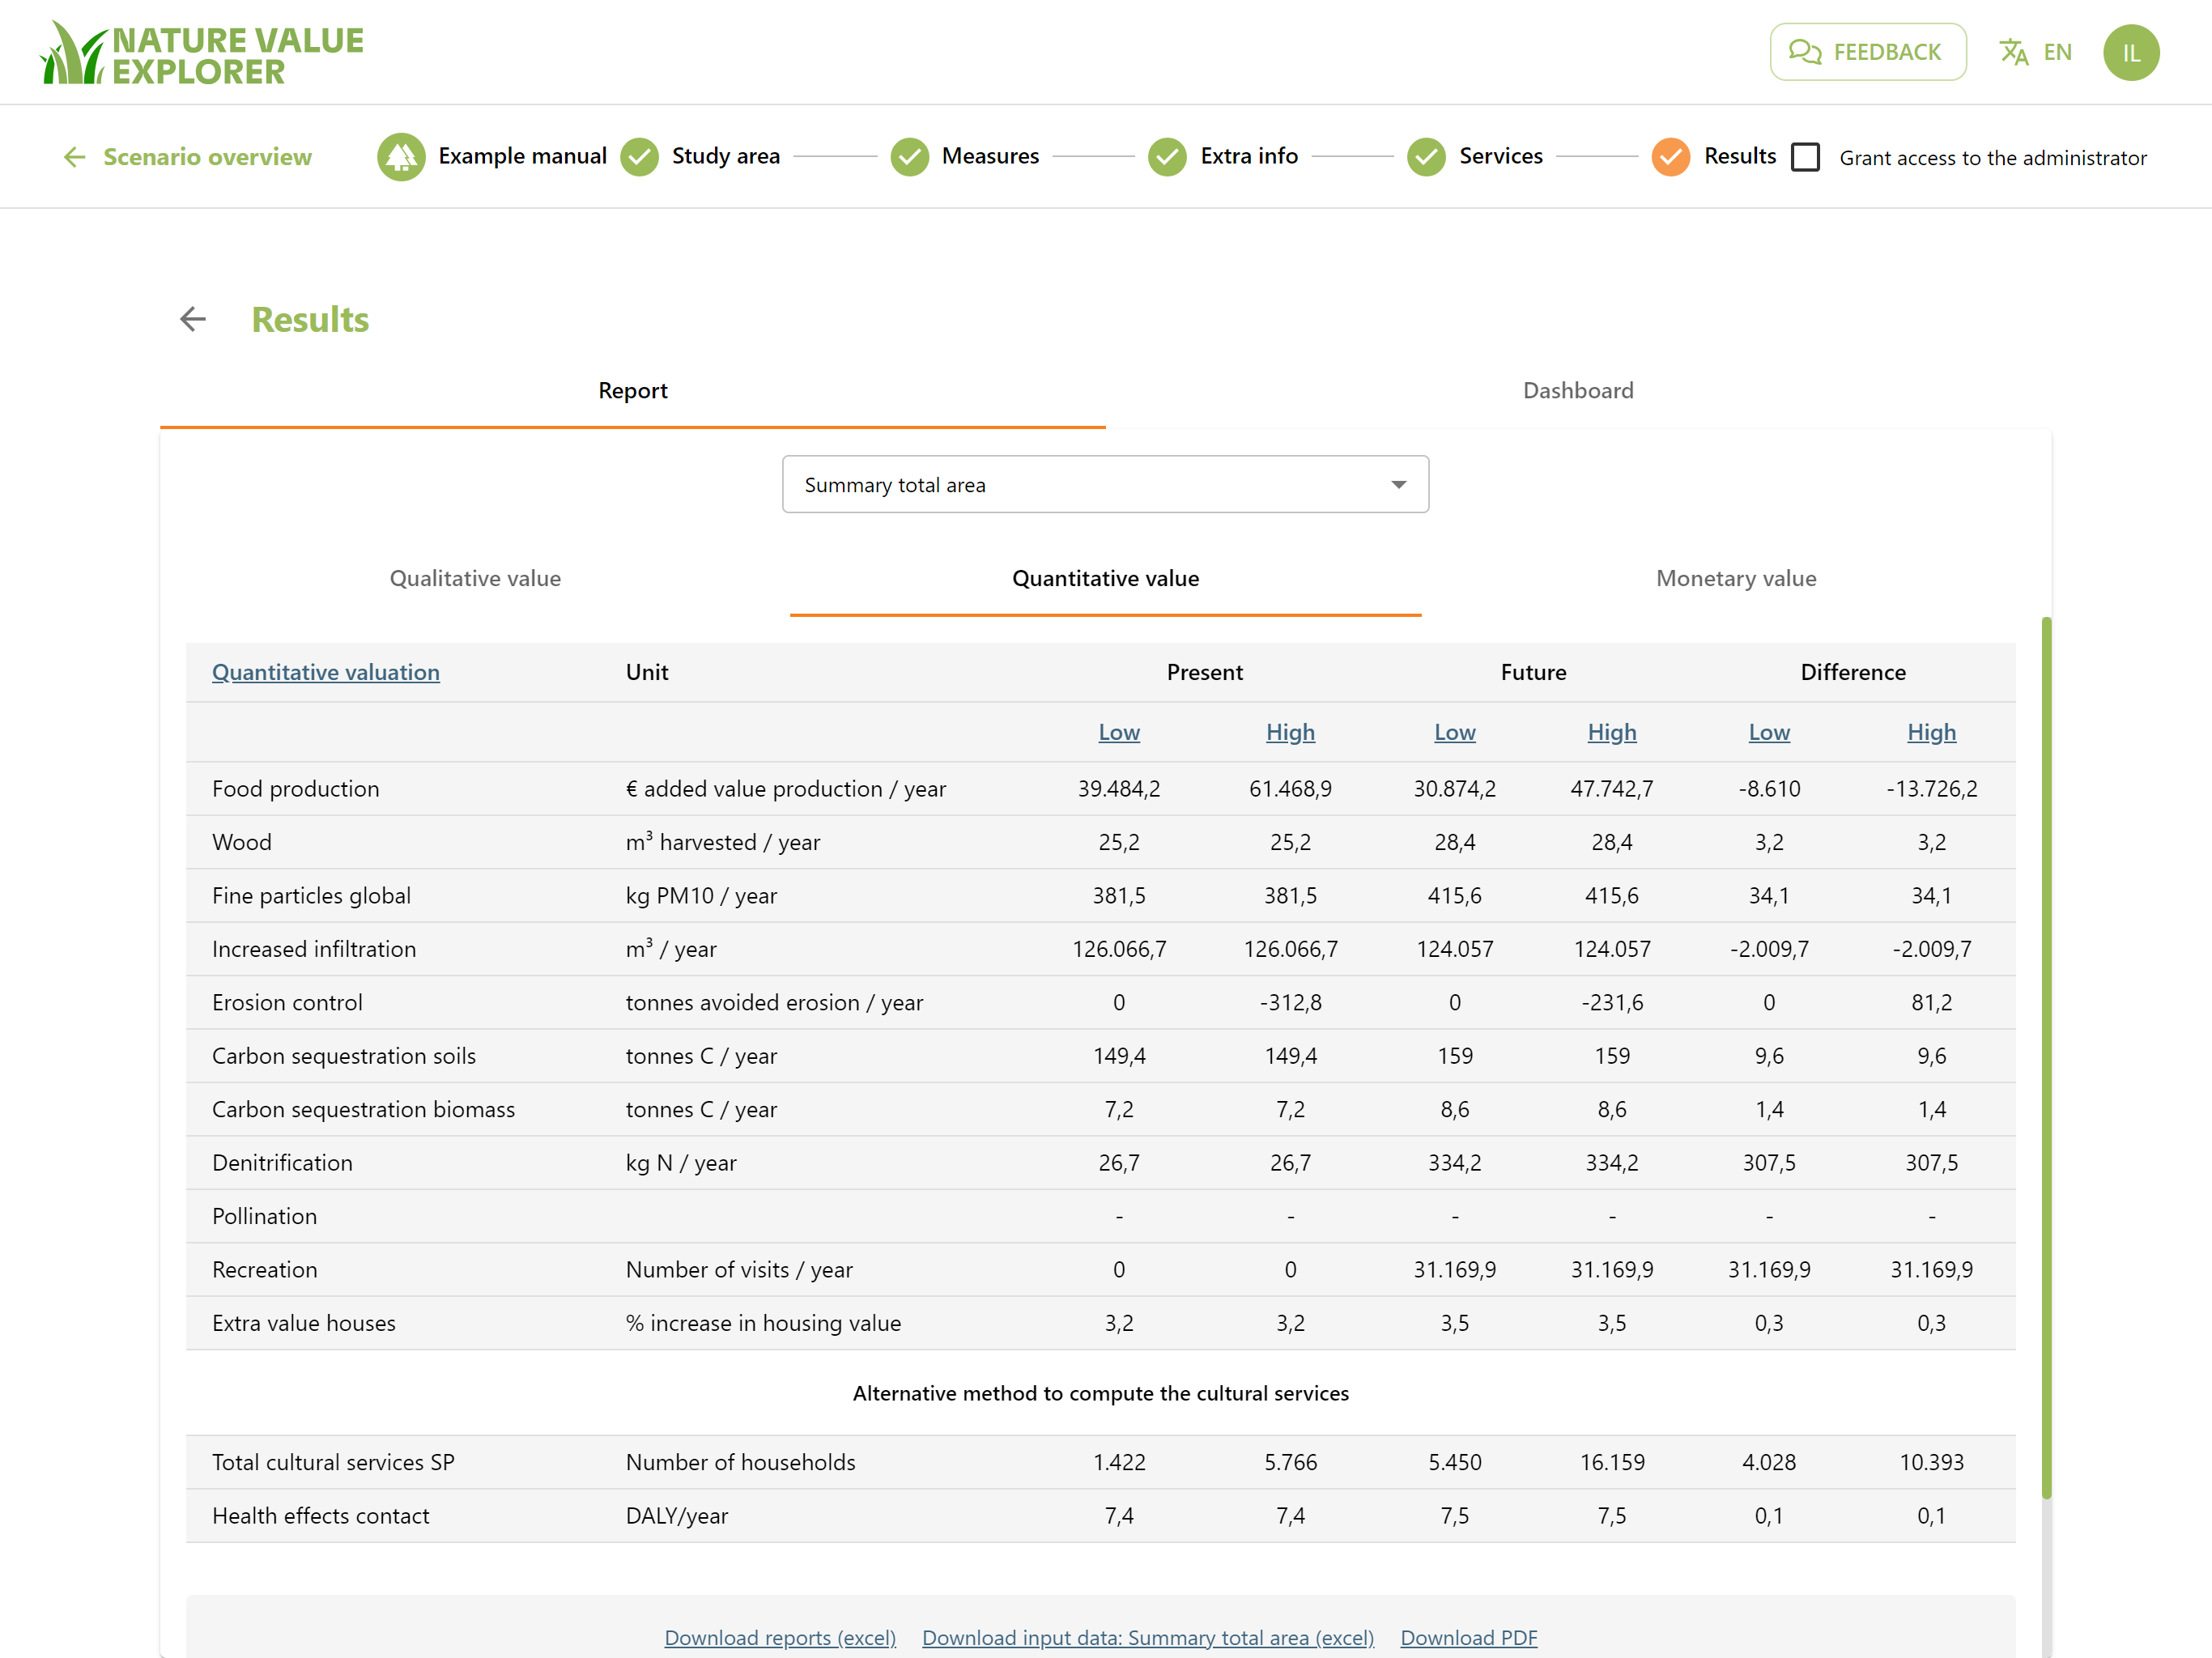
In the example above, we already knew that water infiltration is a relatively important service with little change. In the quantitative valuation we see that it is slightly less because the planted trees absorb more water so that the water cannot infiltrate into the soil.
Since the area was previously inaccessible, the number of visits increased significantly after the construction of the hiking trails. We expect 31 000 visits per year. This also includes the daily visits of people who, for example, walk the dog. By afforestation we ensure that one quarter less soil is eroded. This could prevent mudslides if there is habitation nearby. Locally, this also reduces soil loss.
Monetary valuation
The quantitative valuation gives a different unit for each ecosystem service. For some applications this makes it difficult to compare different scenarios/areas, such as a cost-benefit analysis. As a result, positive effects of or negative effects on nature are sometimes referred to as a post-memory and are therefore ignored in further discussions. Therefore, it can be useful to also convert the value into monetary terms.
Even in some discussions where a lot of financial data is thrown around, it can sometimes be useful to translate the value of the services provided into monetary terms.
We use both key figures and statistical functions here. Not all services can be expressed in monetary terms.
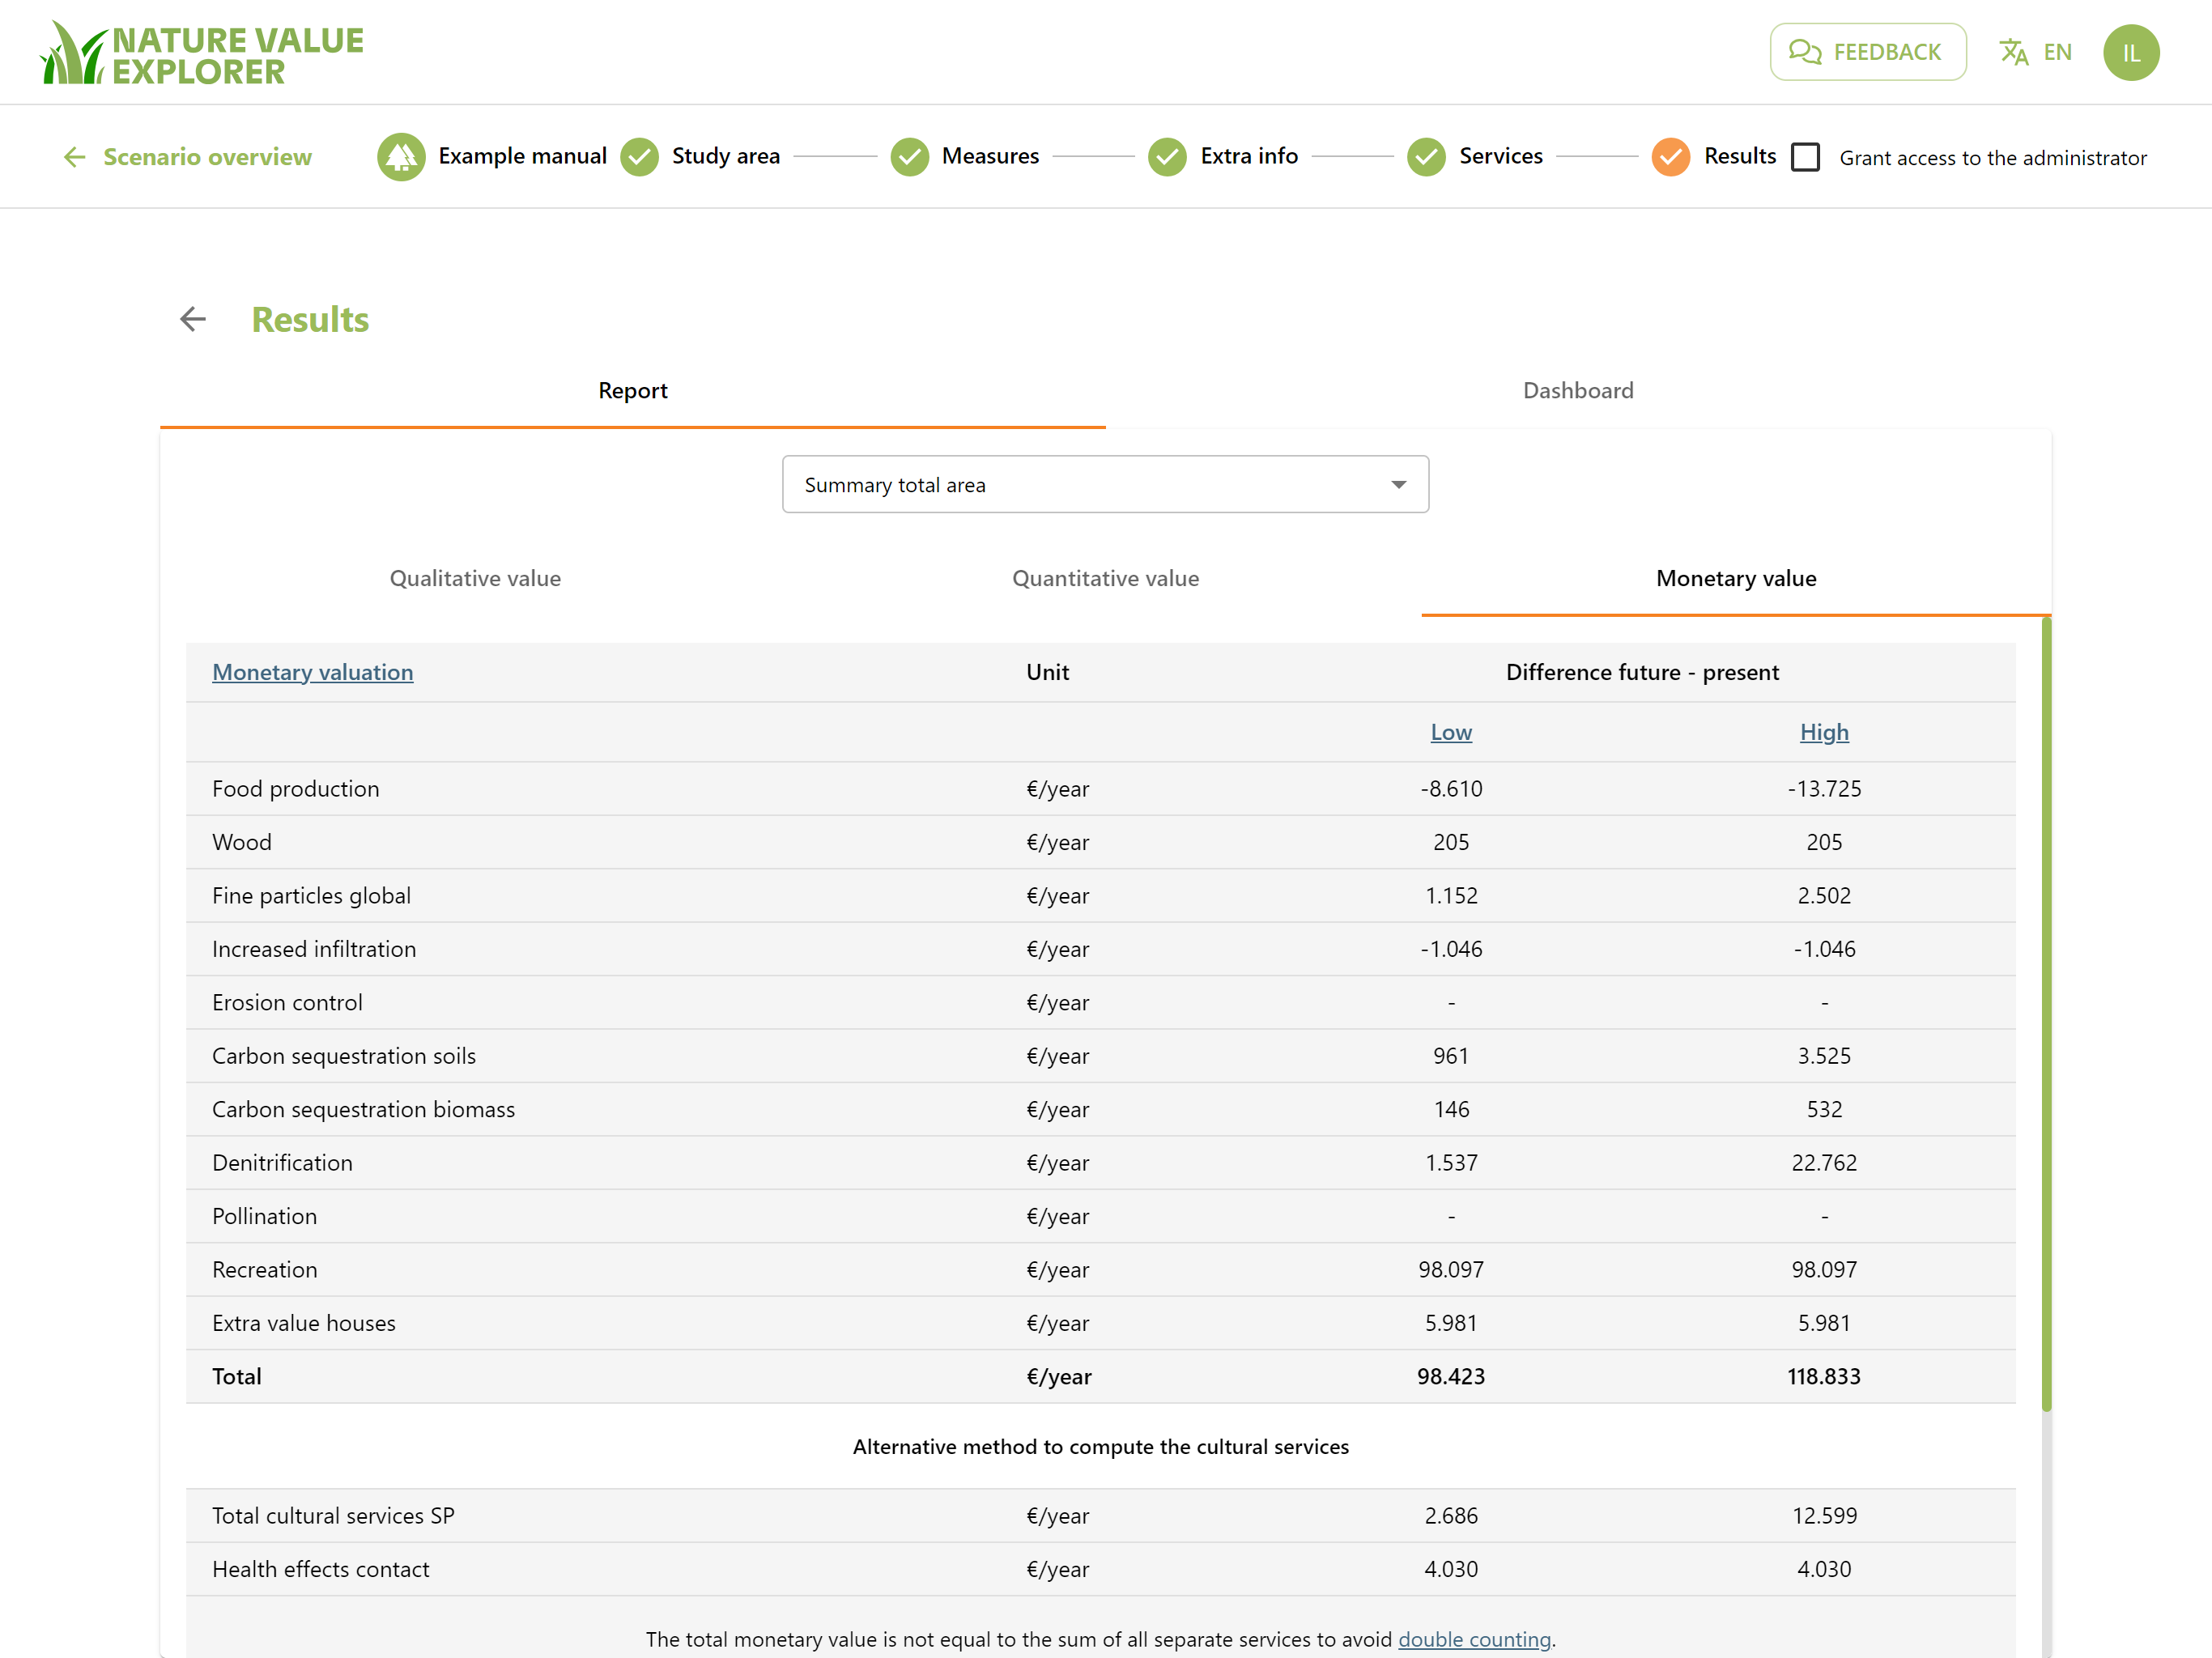
The sum of the complete scenario is not necessarily the sum of all services. This is to avoid double counting (2 ecosystem services that generate the same benefits).
In our example, the planned development plans bring an additional benefit to society of €98,000 to €118,000 per year. This can be weighed against the costs of purchasing, for example, the land, the labor and the planting material.
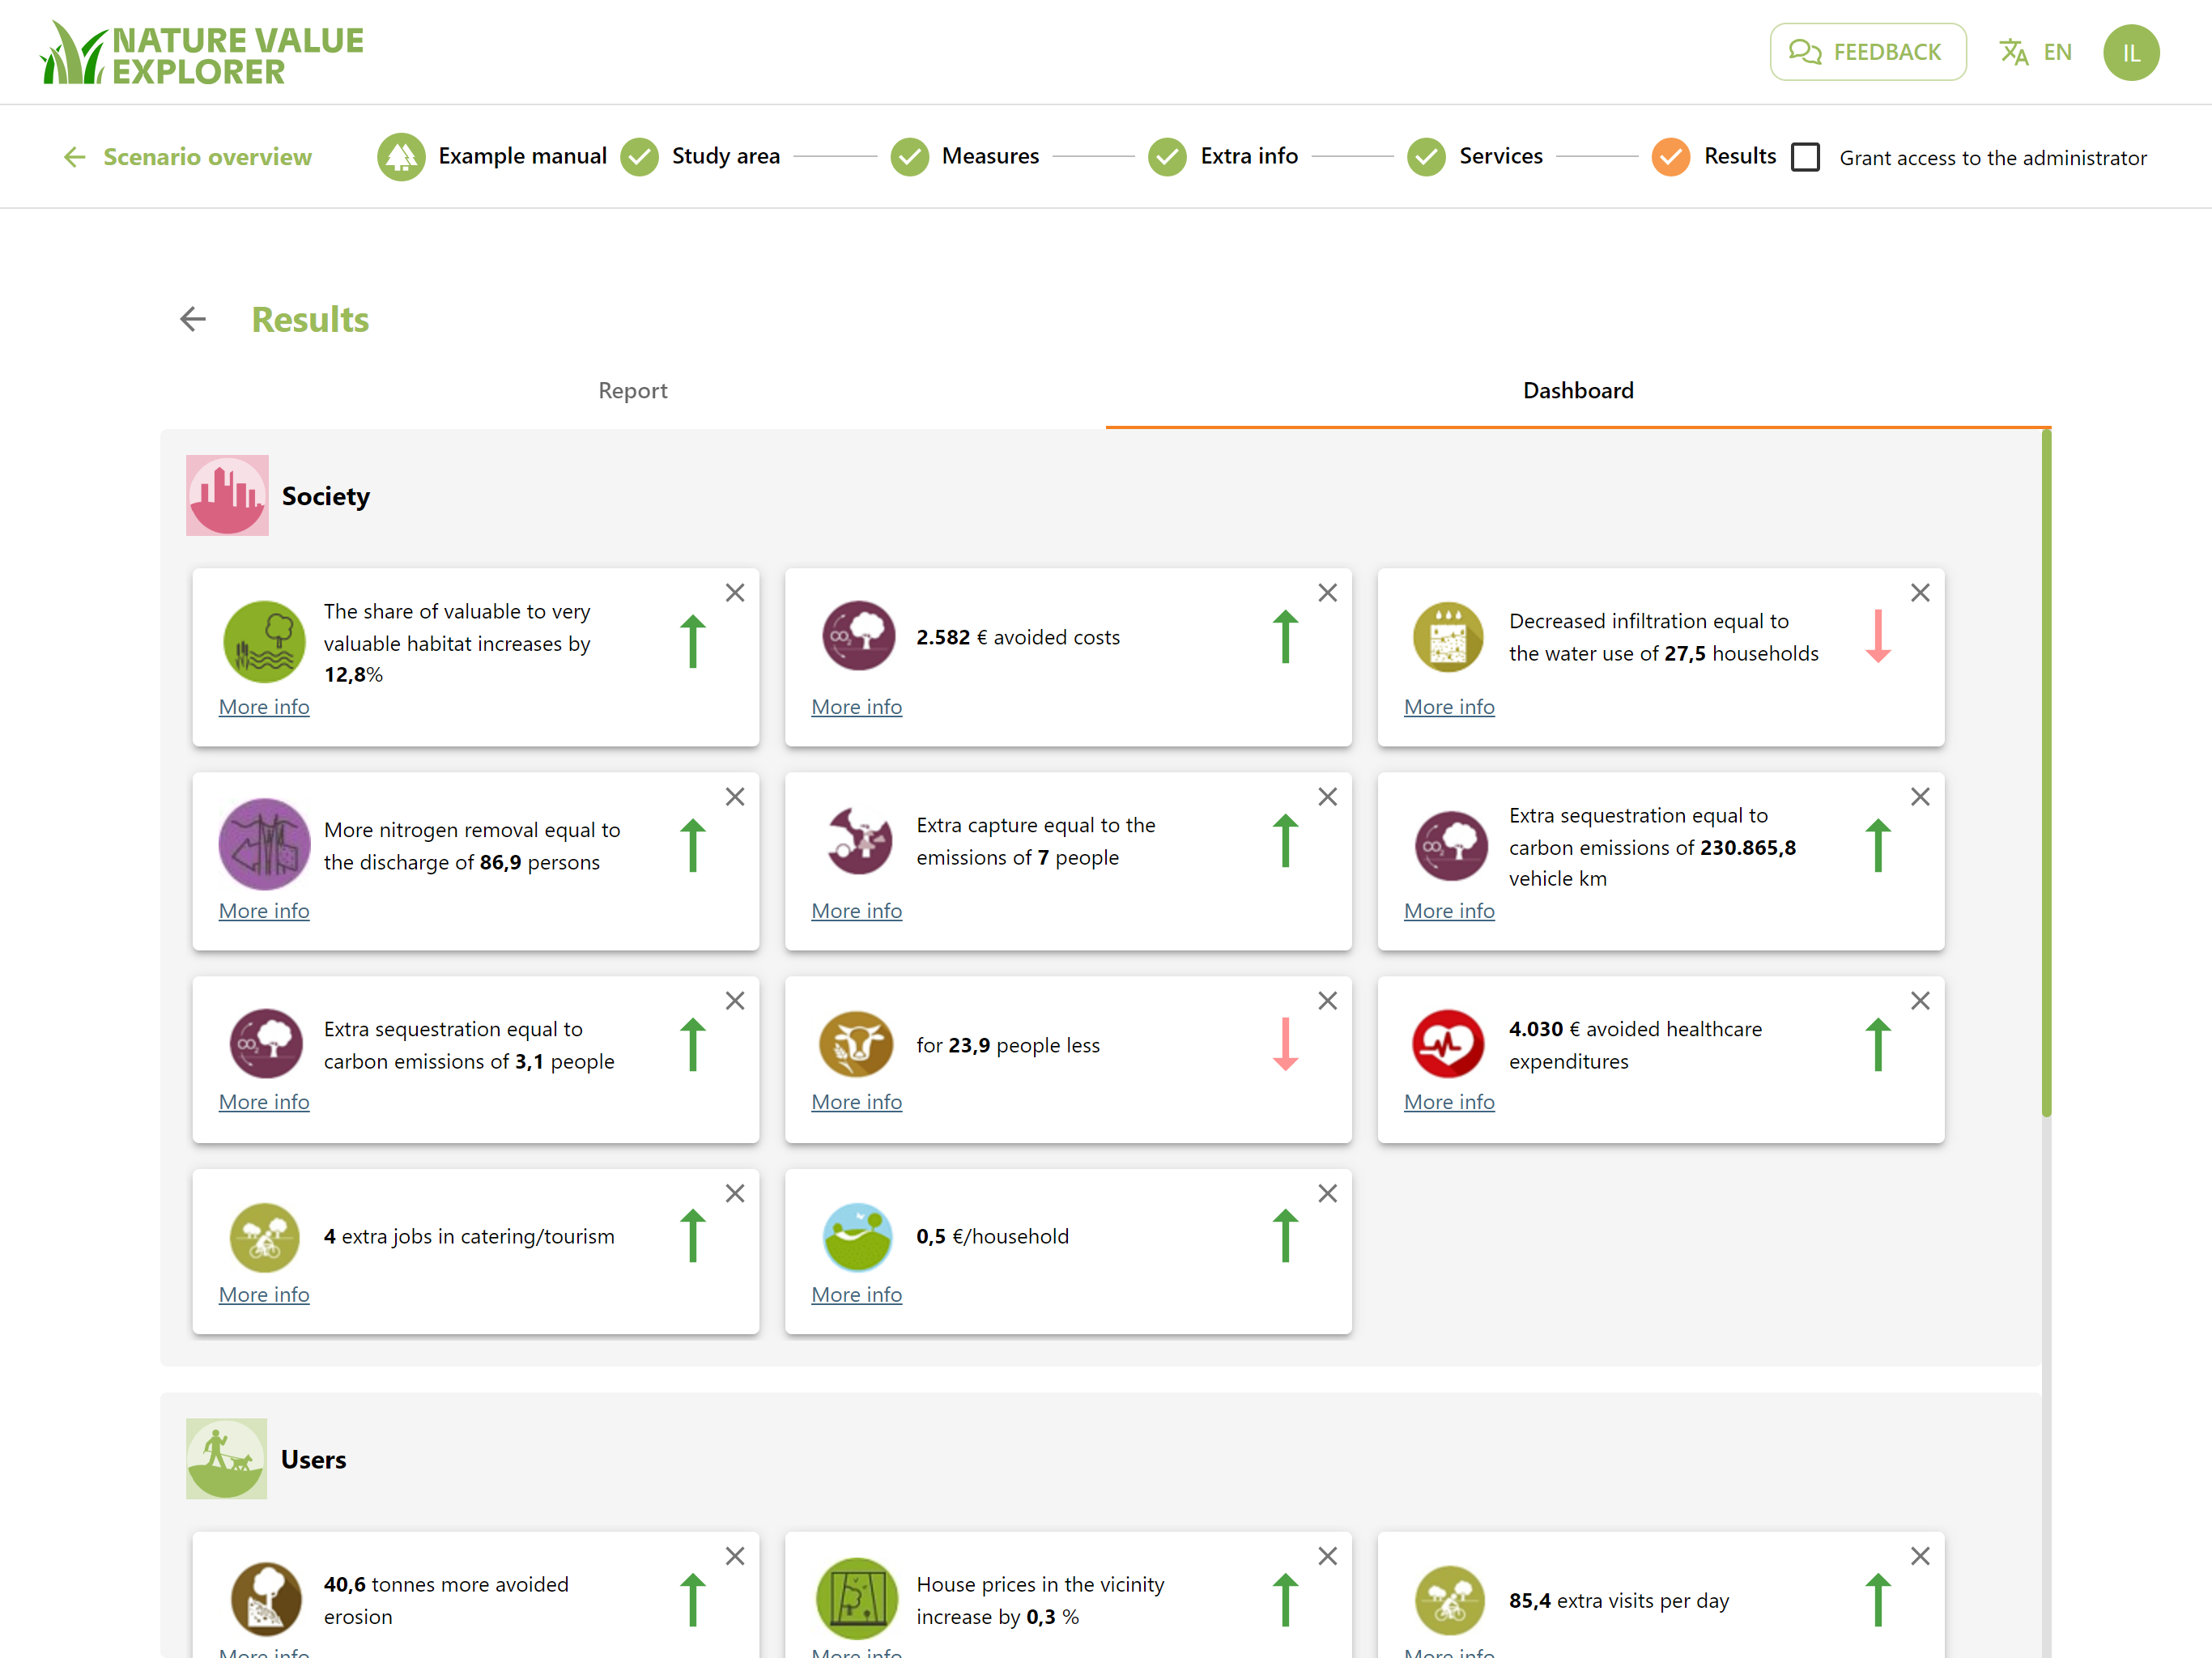
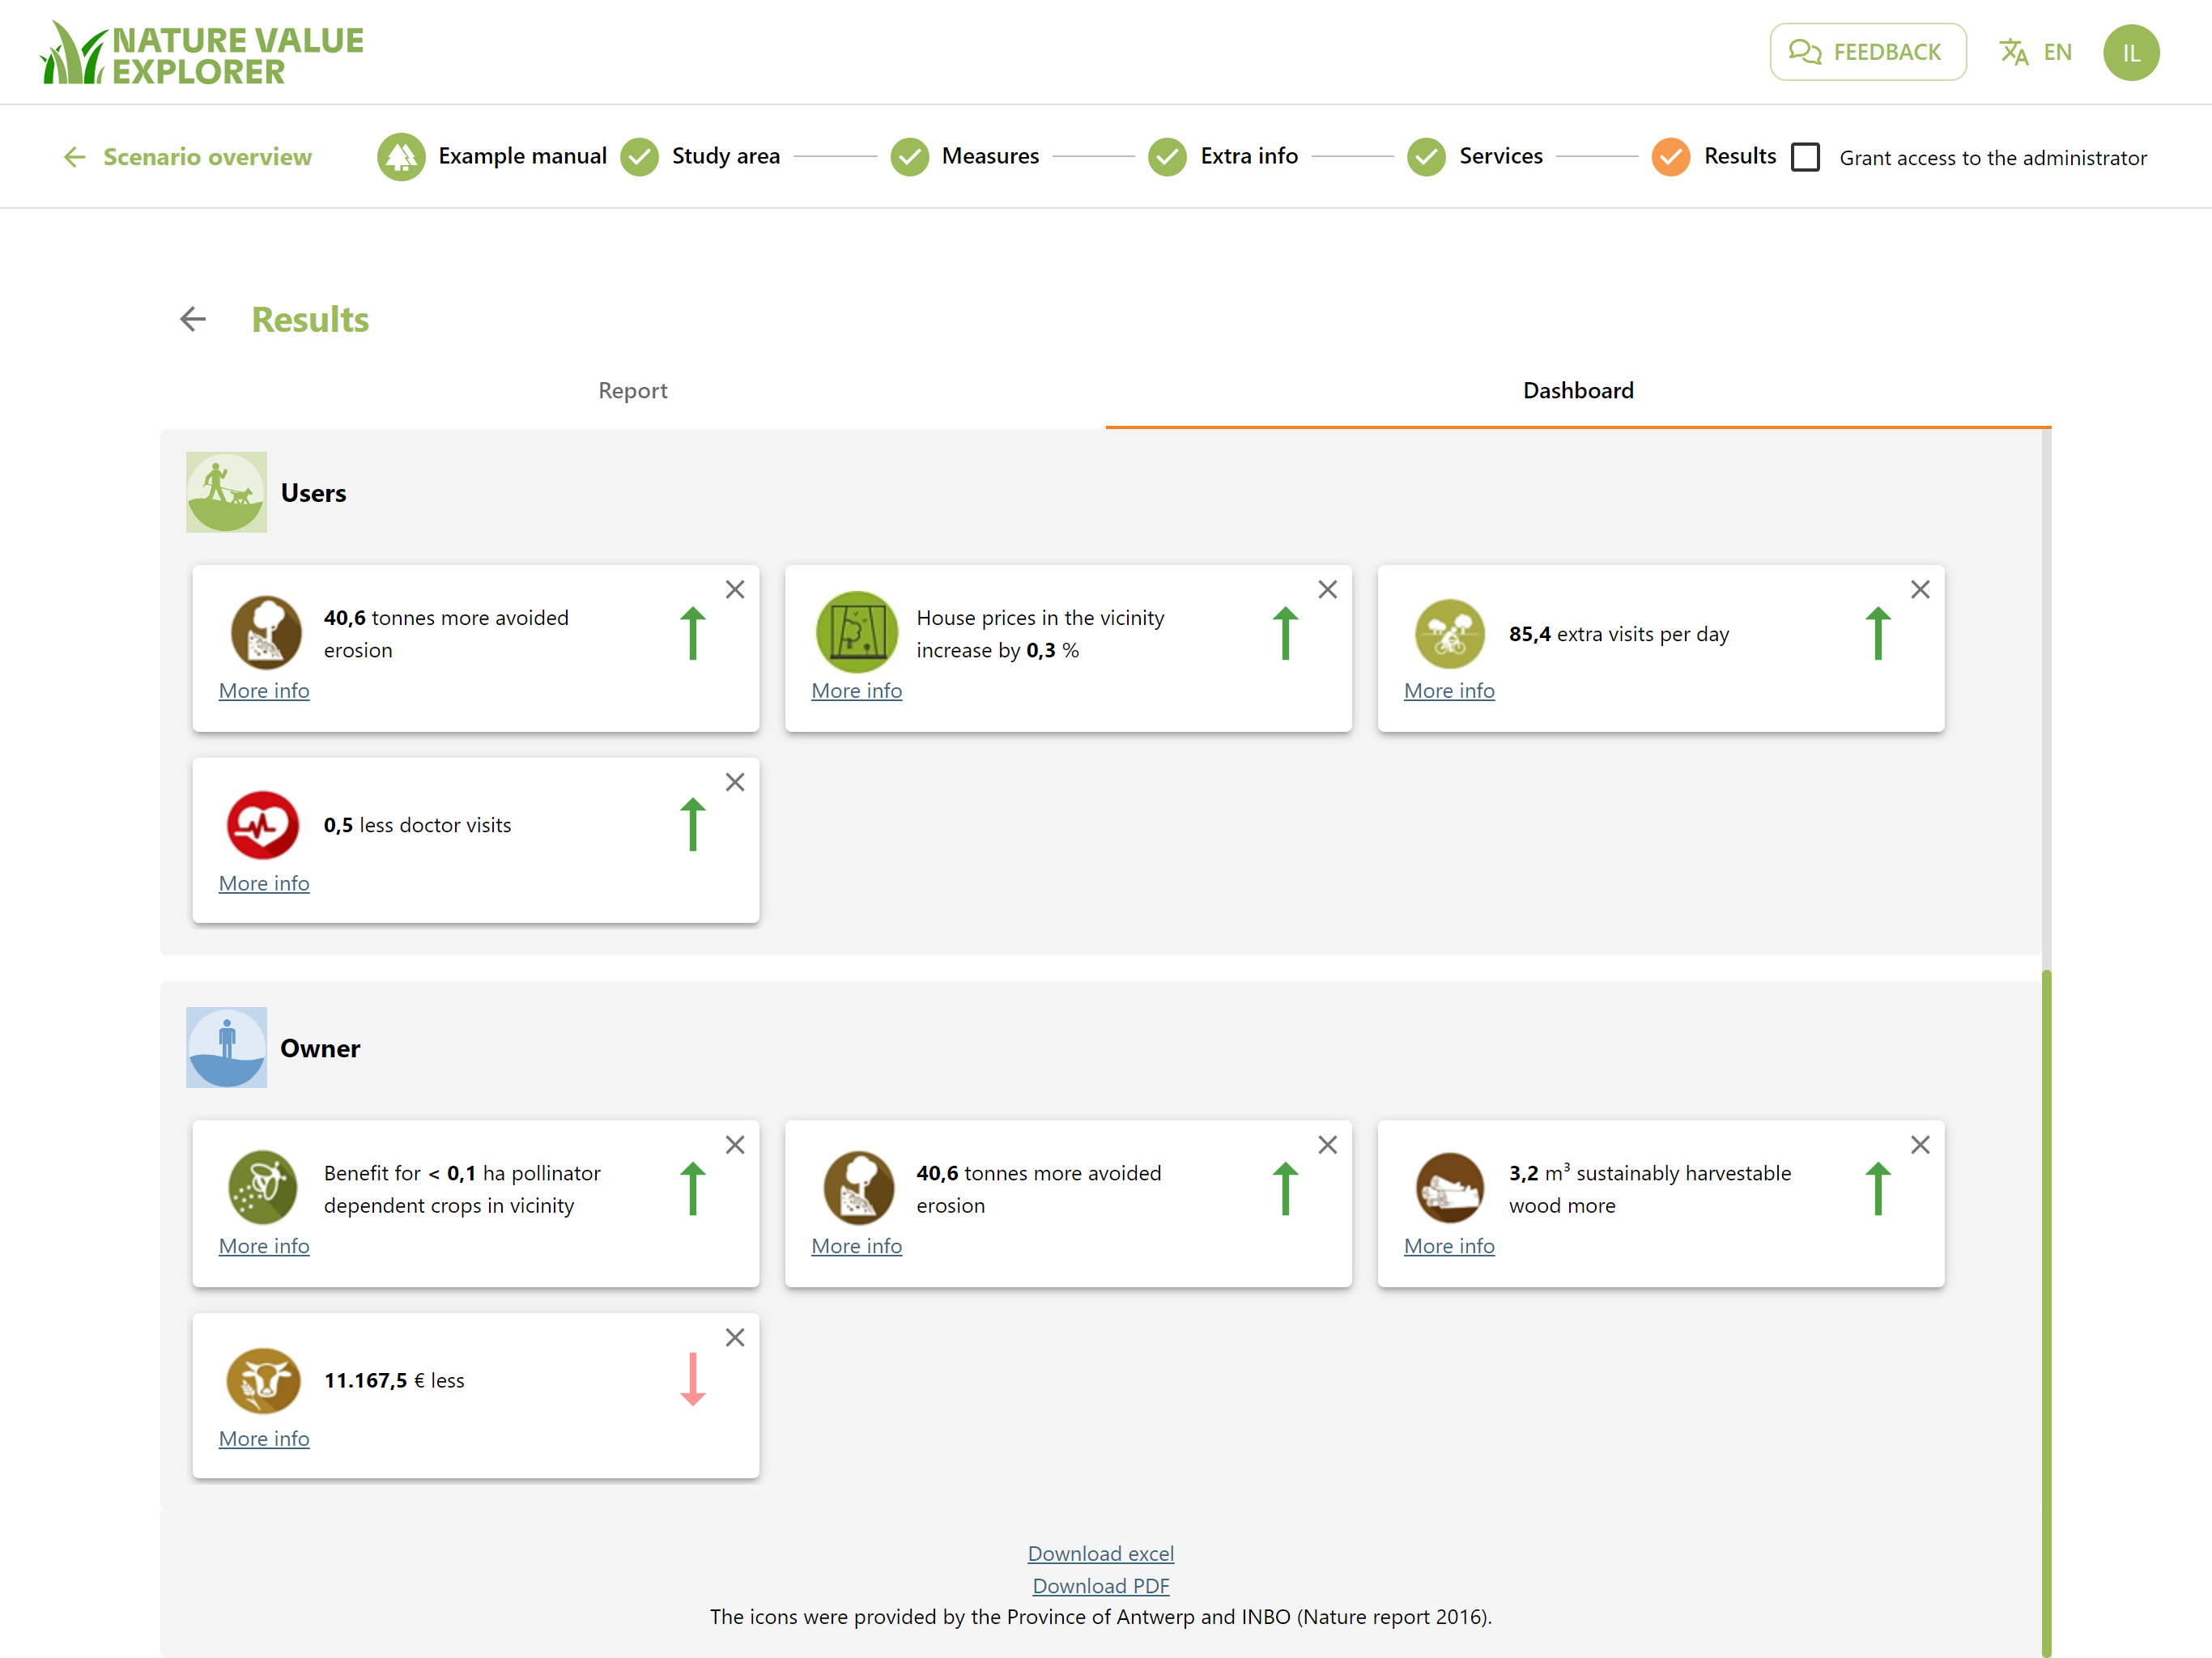
Dashboard
If you are not immediately familiar with the subject of ecosystem services and their valuation, the figures from the Nature Value Explorer may be difficult to understand. For example, is an increase in sequestration of 10 tons of C per year a lot or not?
To meet this need, we translate the biophysical data into easier-to-understand indicators. These are displayed in a dashboard and classified according to whom experiences this impact: society, user or owner.
For example, we learn that the increase in carbon storage is equal to the annual carbon emissions of 3 people in Belgium.
The willingness to pay for more forest at that location is €0.5 per household per year.
Download all results
At the bottom of the report page and the dashboard you will see the following buttons:
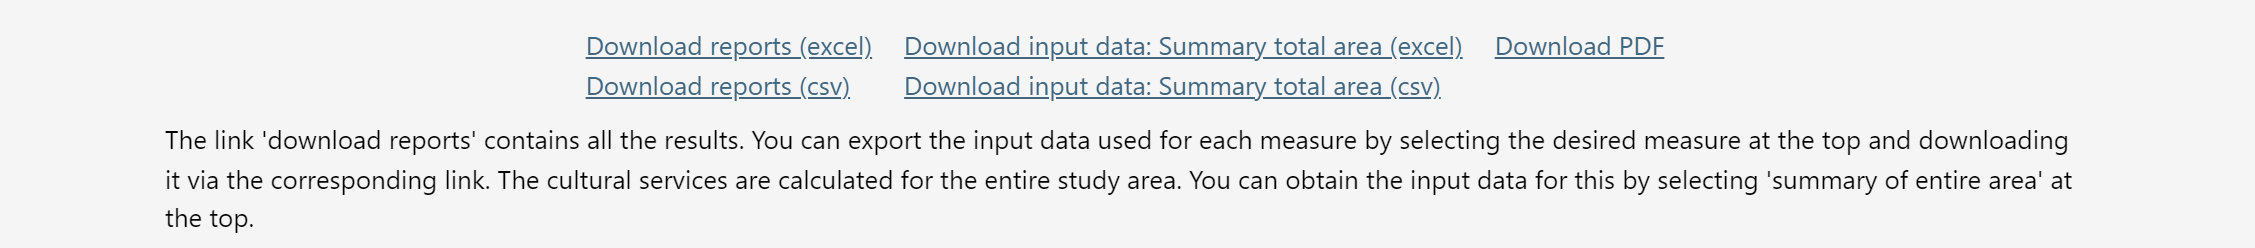
This allows you to download the information of your scenario. In Excel or CVS you will not only find the results, but you will also receive the data used per service and a link to an example in the manual of how the calculation is done correctly.
This way the tool does not remain a black box and you know exactly what was calculated.
An example for capture of particulate matter:
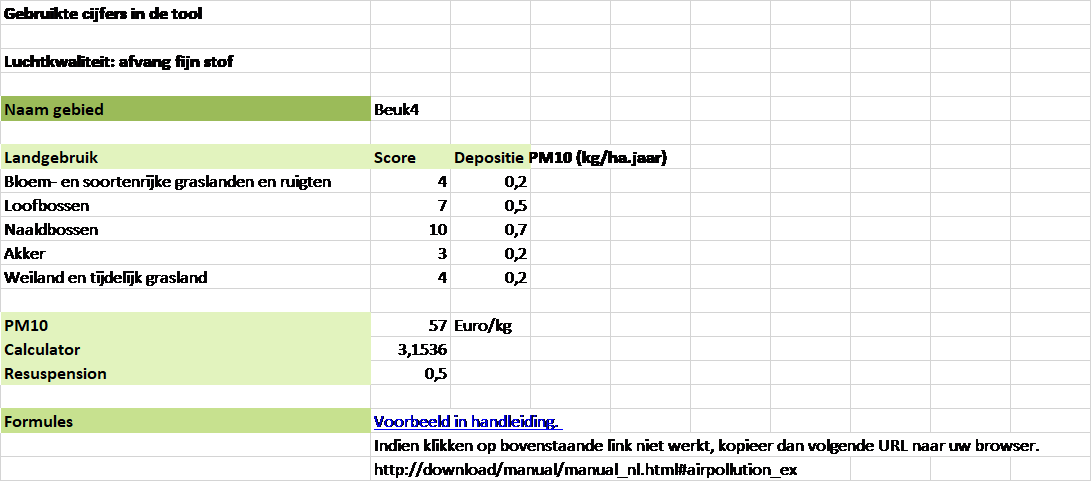
We are still optimizing these files.
The dashboard can also be downloaded in Excel, CSV or PDF.