The study area
A study area is a contiguous area in which changes in land use occur or where changes to the ecosystem take place. A division into areas applies if it actually concerns physically separated areas. You then create a scenario per area.
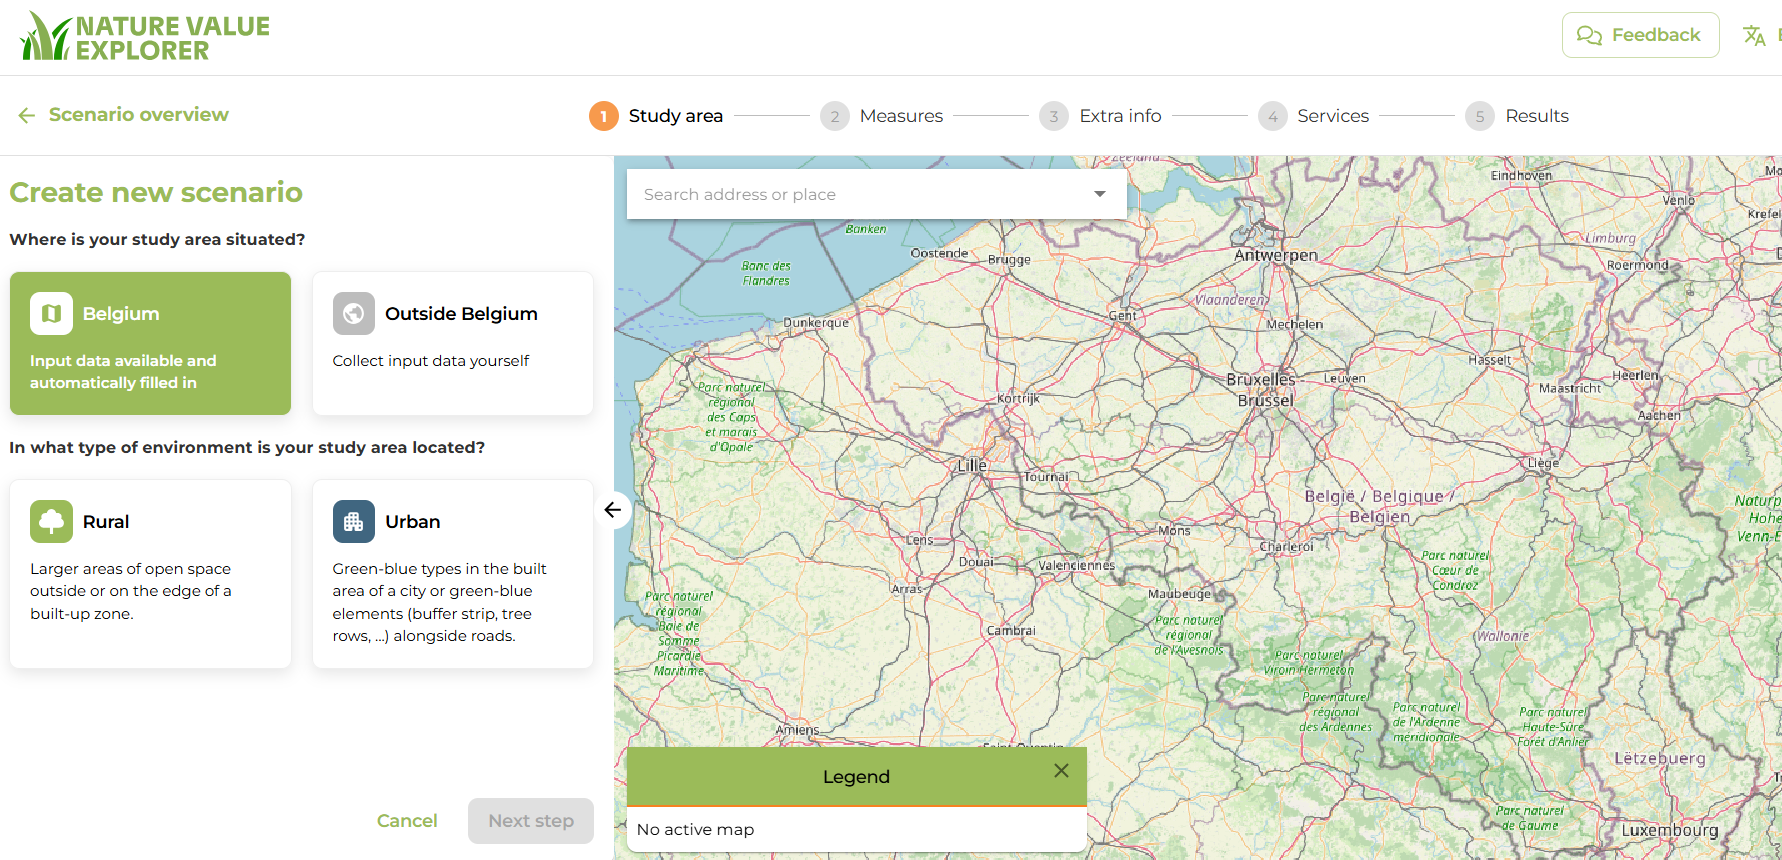
First, indicate whether the study area falls within or outside Belgium. For cross-border areas, it's best to select "outside Belgium," otherwise the tool will cut off the area at the border. For areas outside Belgium, the required input data is not available in the tool. You will need to collect it yourself. The required data are listed in the appendix.
Second, examine whether this study area has a rural or urban context. By urban context we understand the area within the built-up zone of a municipality or city and green elements (buffer strips, rows of trees, etc.) along ring roads. By rural area we mean larger units of open space outside or on the edge of a built-up zone.
If the answer is urban area, go to the manual Nature Value Explorer City. Otherwise, follow the further steps in this guide.
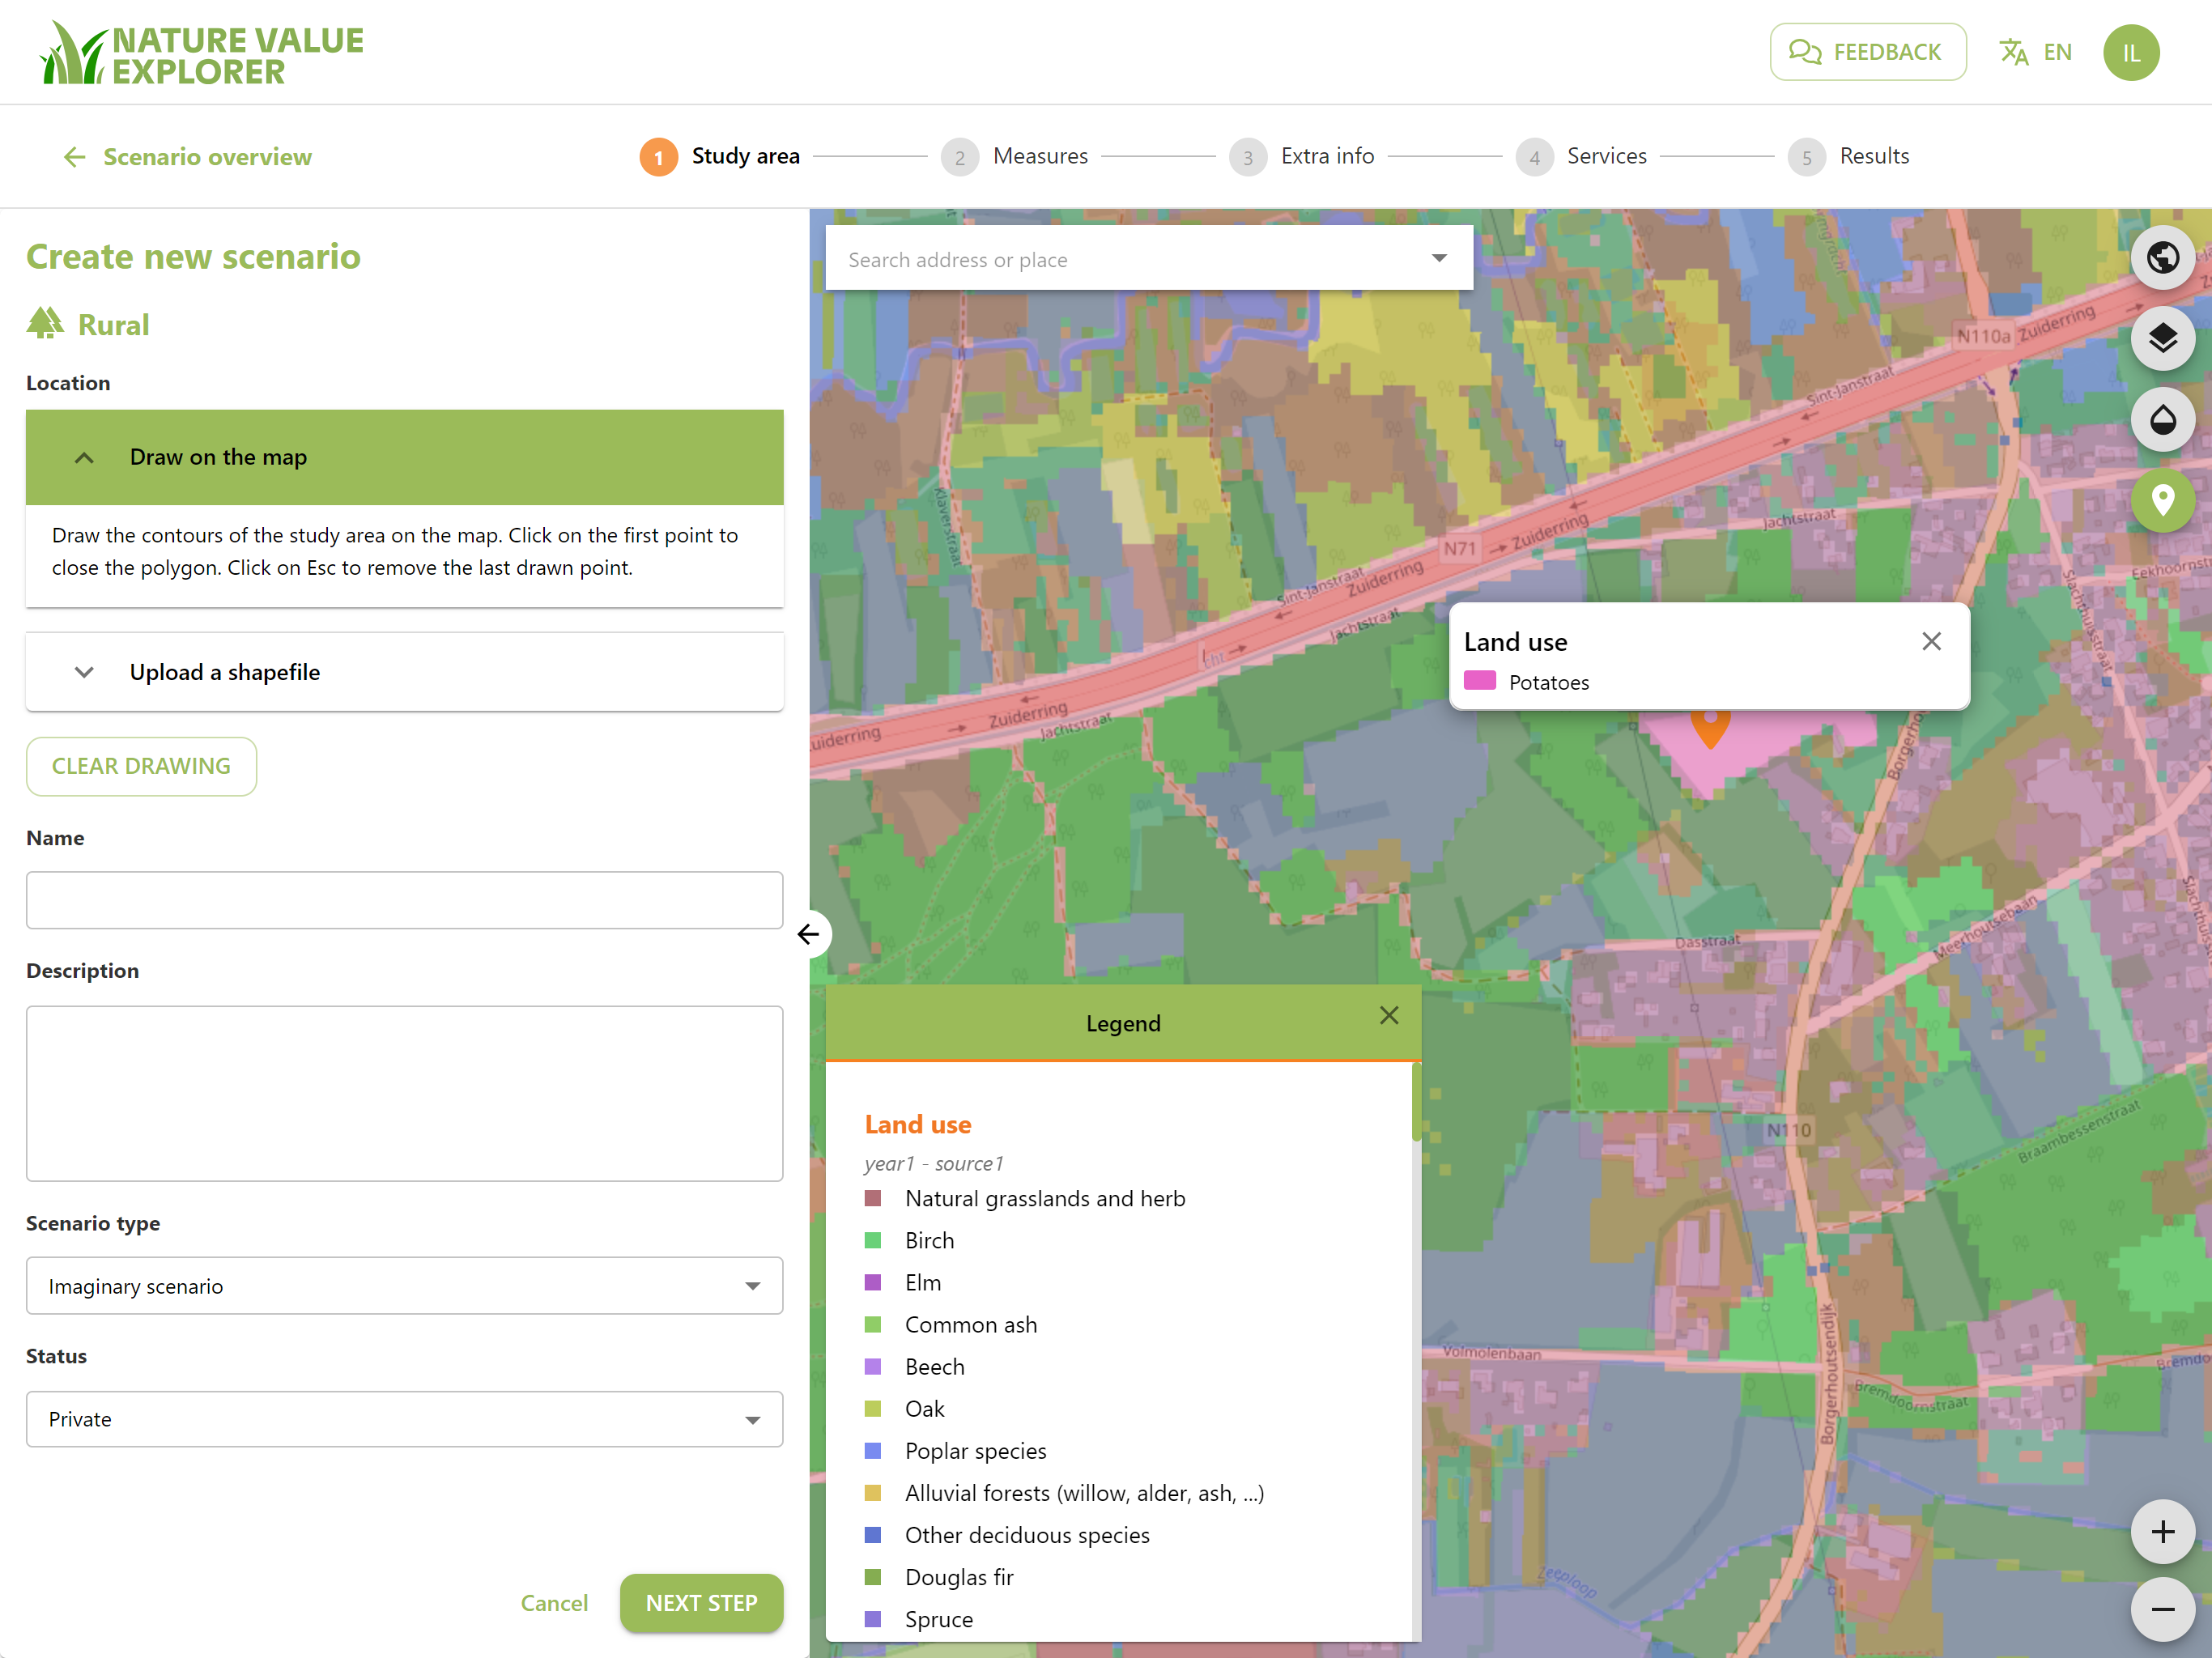
Click on 'rural' and then on 'next step'.
You now have options to plan the study area:
- You draw your area
- You have shapefiles of your area and the measures available
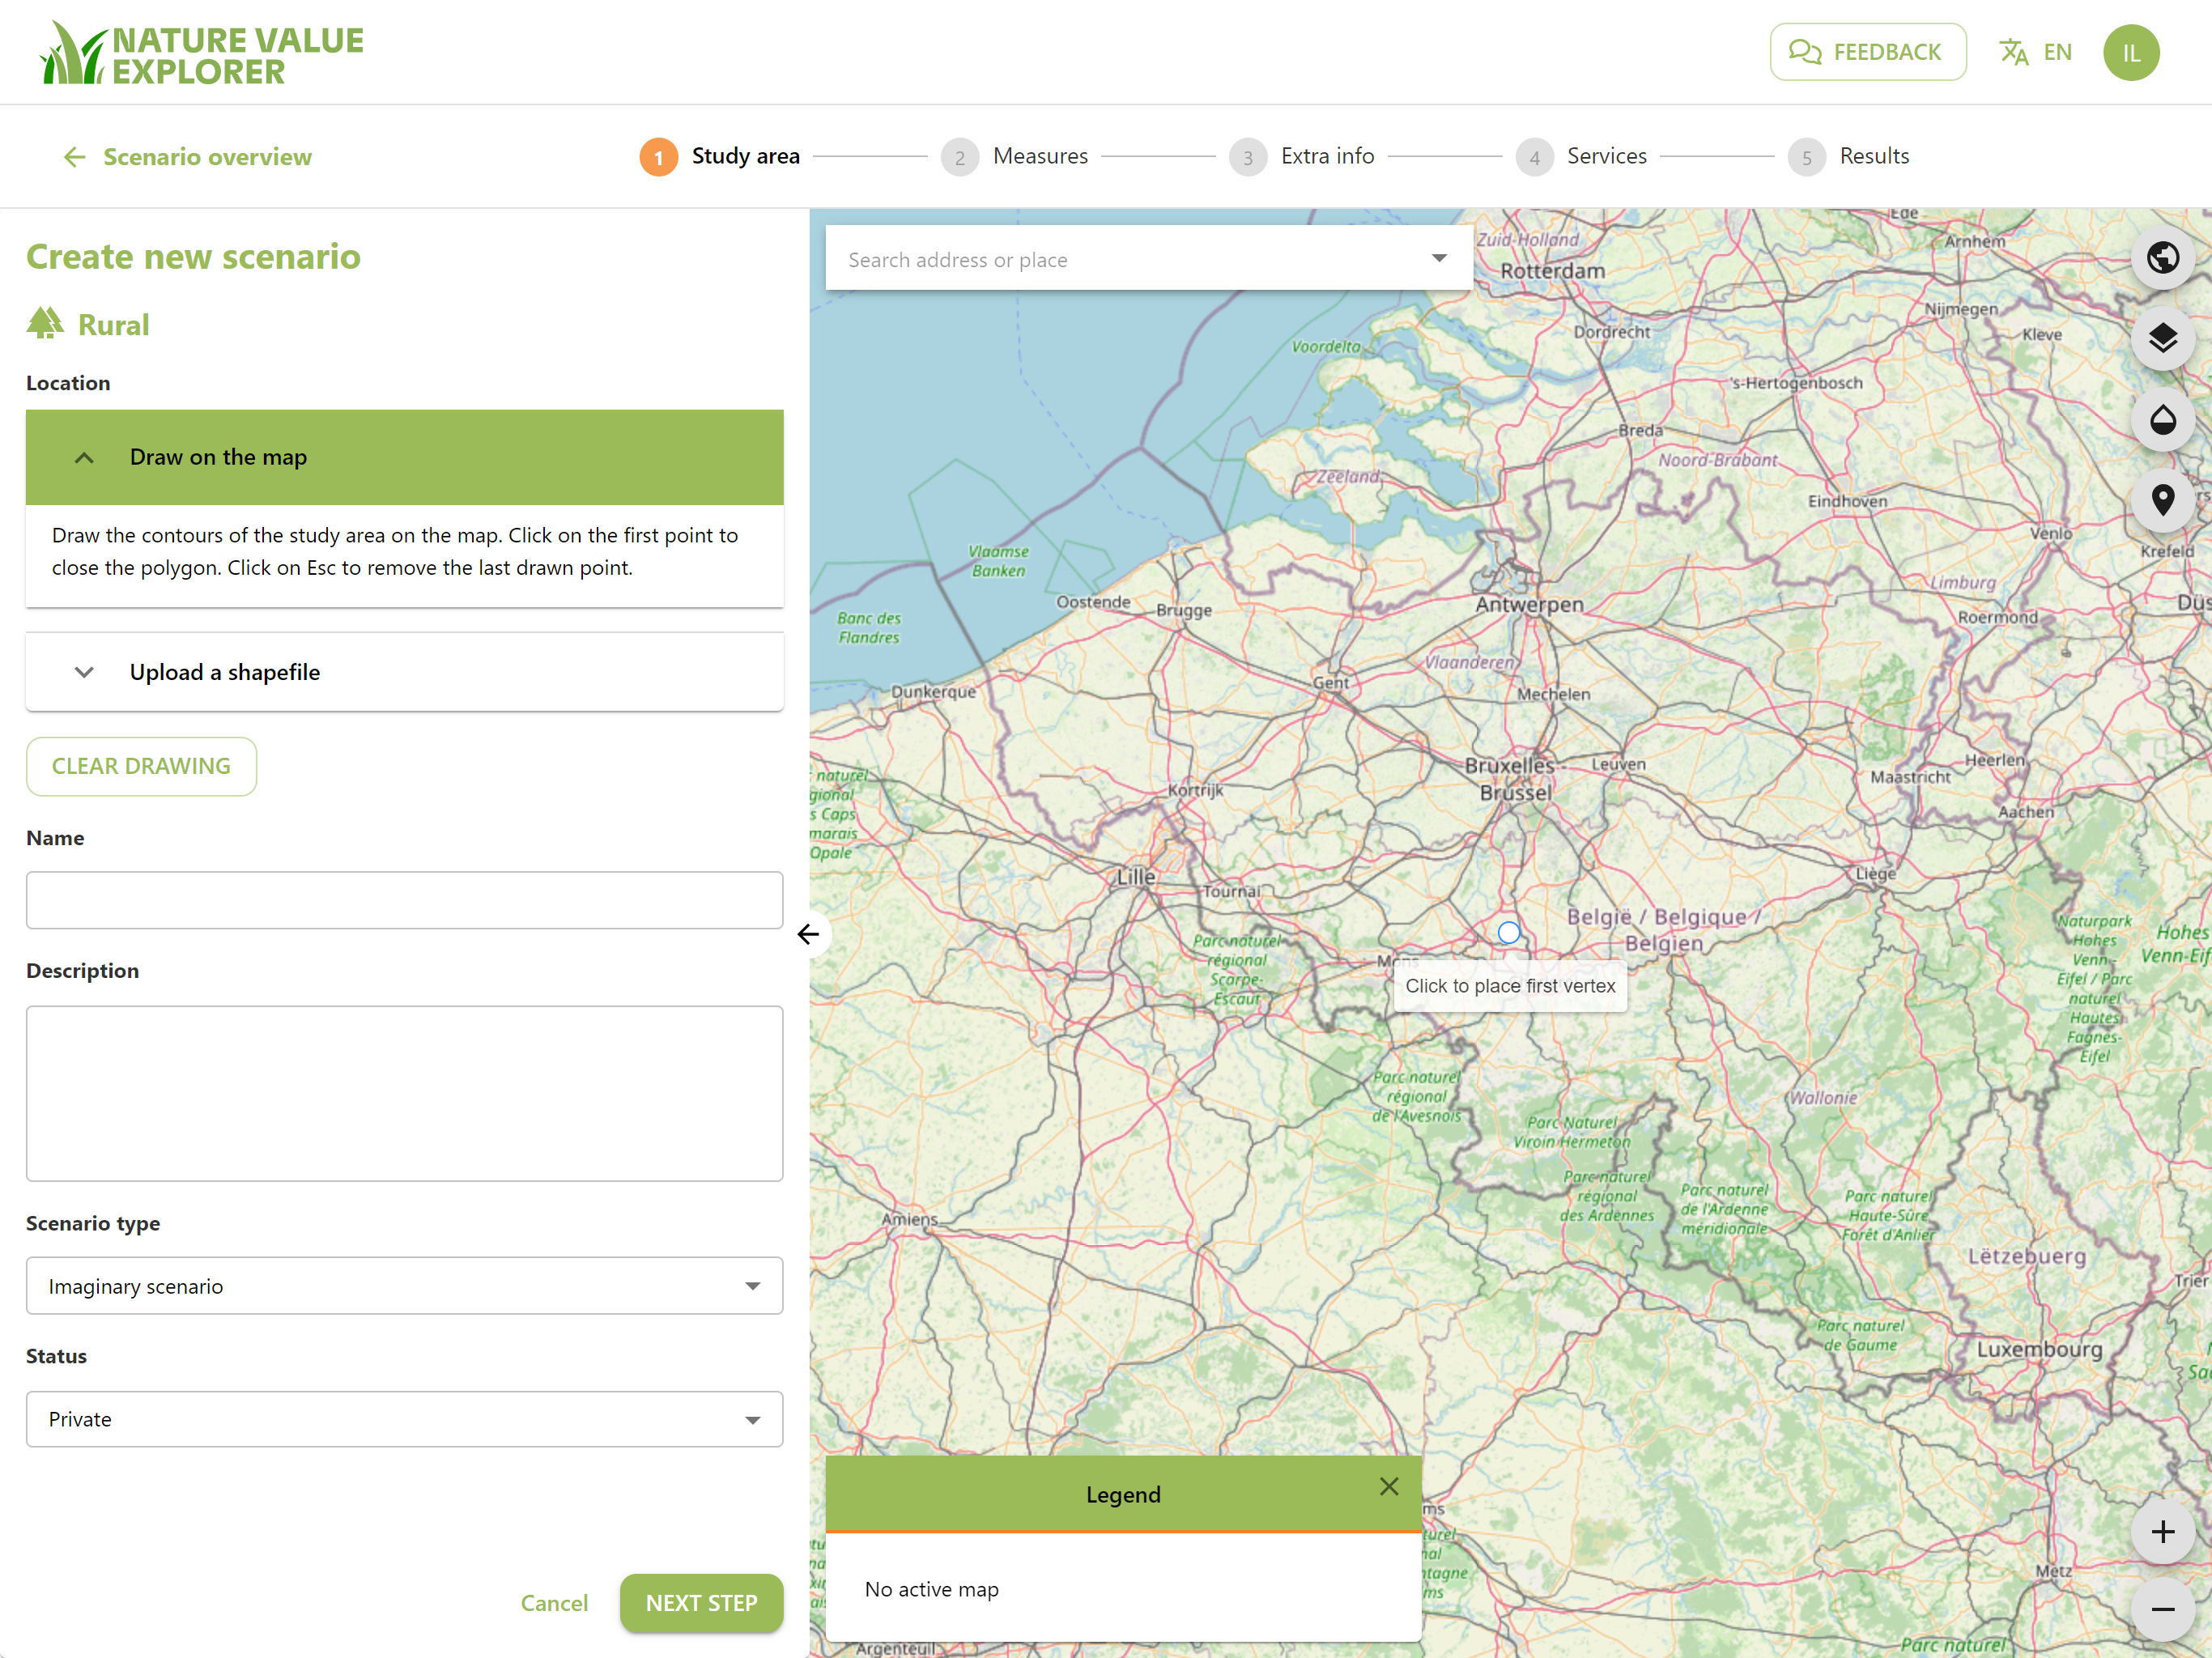
Drawing
If you want to draw an area, you can search for the location by typing a street and municipality in the white field at the top left of the map. You can zoom in and zoom out by scrolling or pressing the + or - button at the bottom right of the map.
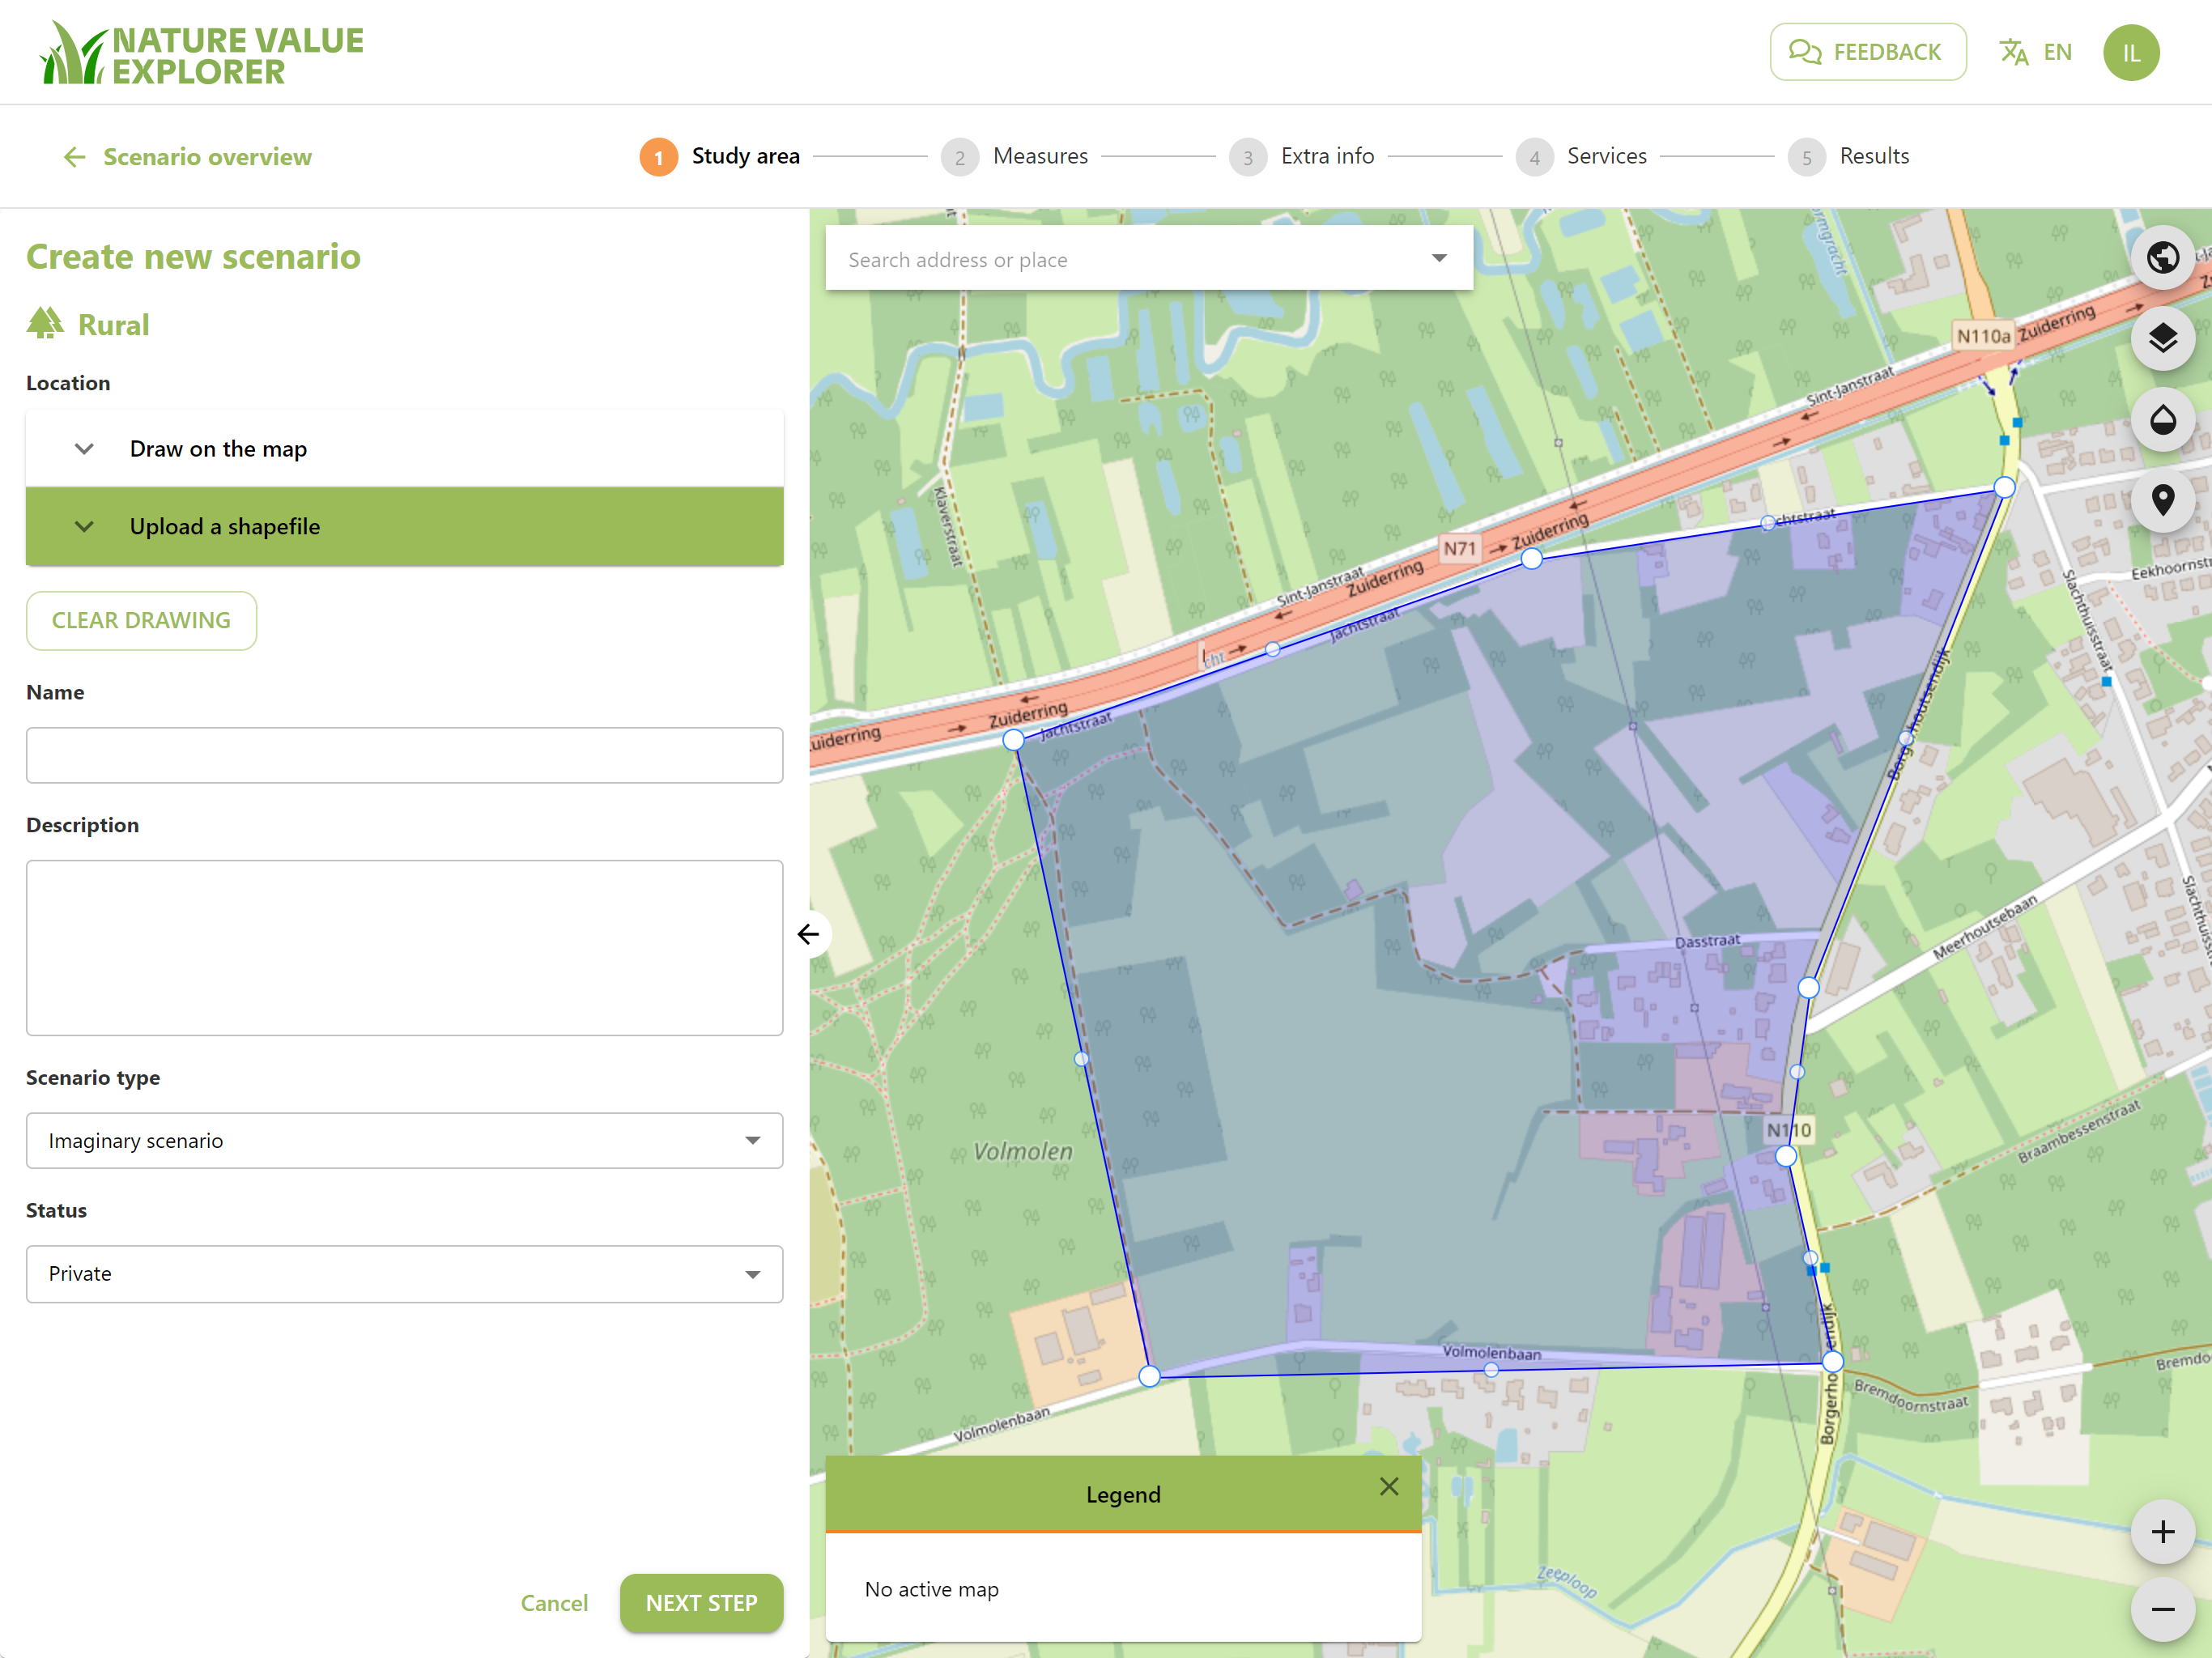
If you slide the mouse over the map, you will see a white dot appear. You place the mouse on the starting point and click the left mouse button. This way you can continue to add points to the map until the area closes.
You can still adjust the polygon by standing on the edge with the mouse and dragging a white ball.
You can also delete the drawing by pressing the Clear drawing button.
Uploading
If you have a shapefile, click upload a shapefile.
The file you choose to upload must meet the following conditions:
- a zip file with 1 shape file and associated components (at least .shp, .dbf and .shx)
- the shape file can only consist of one polygon demarcating the study area
- the shape file must not contain points or lines
After uploading the file, it is best to indicate in which geographical project system your shape file is located. Otherwise, your area could end up in the ocean. The lambert coordinate system is usually used for Belgium.
Scenario details
Give your scenario a name and a description.
Choose a scenario type from the dropdown list:
- Imaginary scenario
- Actual scenario but you only use it as a test
- Actual scenario of which you also plan to use the results as decision support or communication tool or...
Indicate whether the study area is private or public. If it is public, it can be viewed by anyone.
When done, press the green button "Next Step"
From then on you can no longer change or delete the drawing!
Background map
By default, the background map is set to Open street maps. You can change this background via the top icon ![]() or show one of our input maps
or show one of our input maps ![]() . For more information about the input maps, we refer to the chapter about the input data.
. For more information about the input maps, we refer to the chapter about the input data.
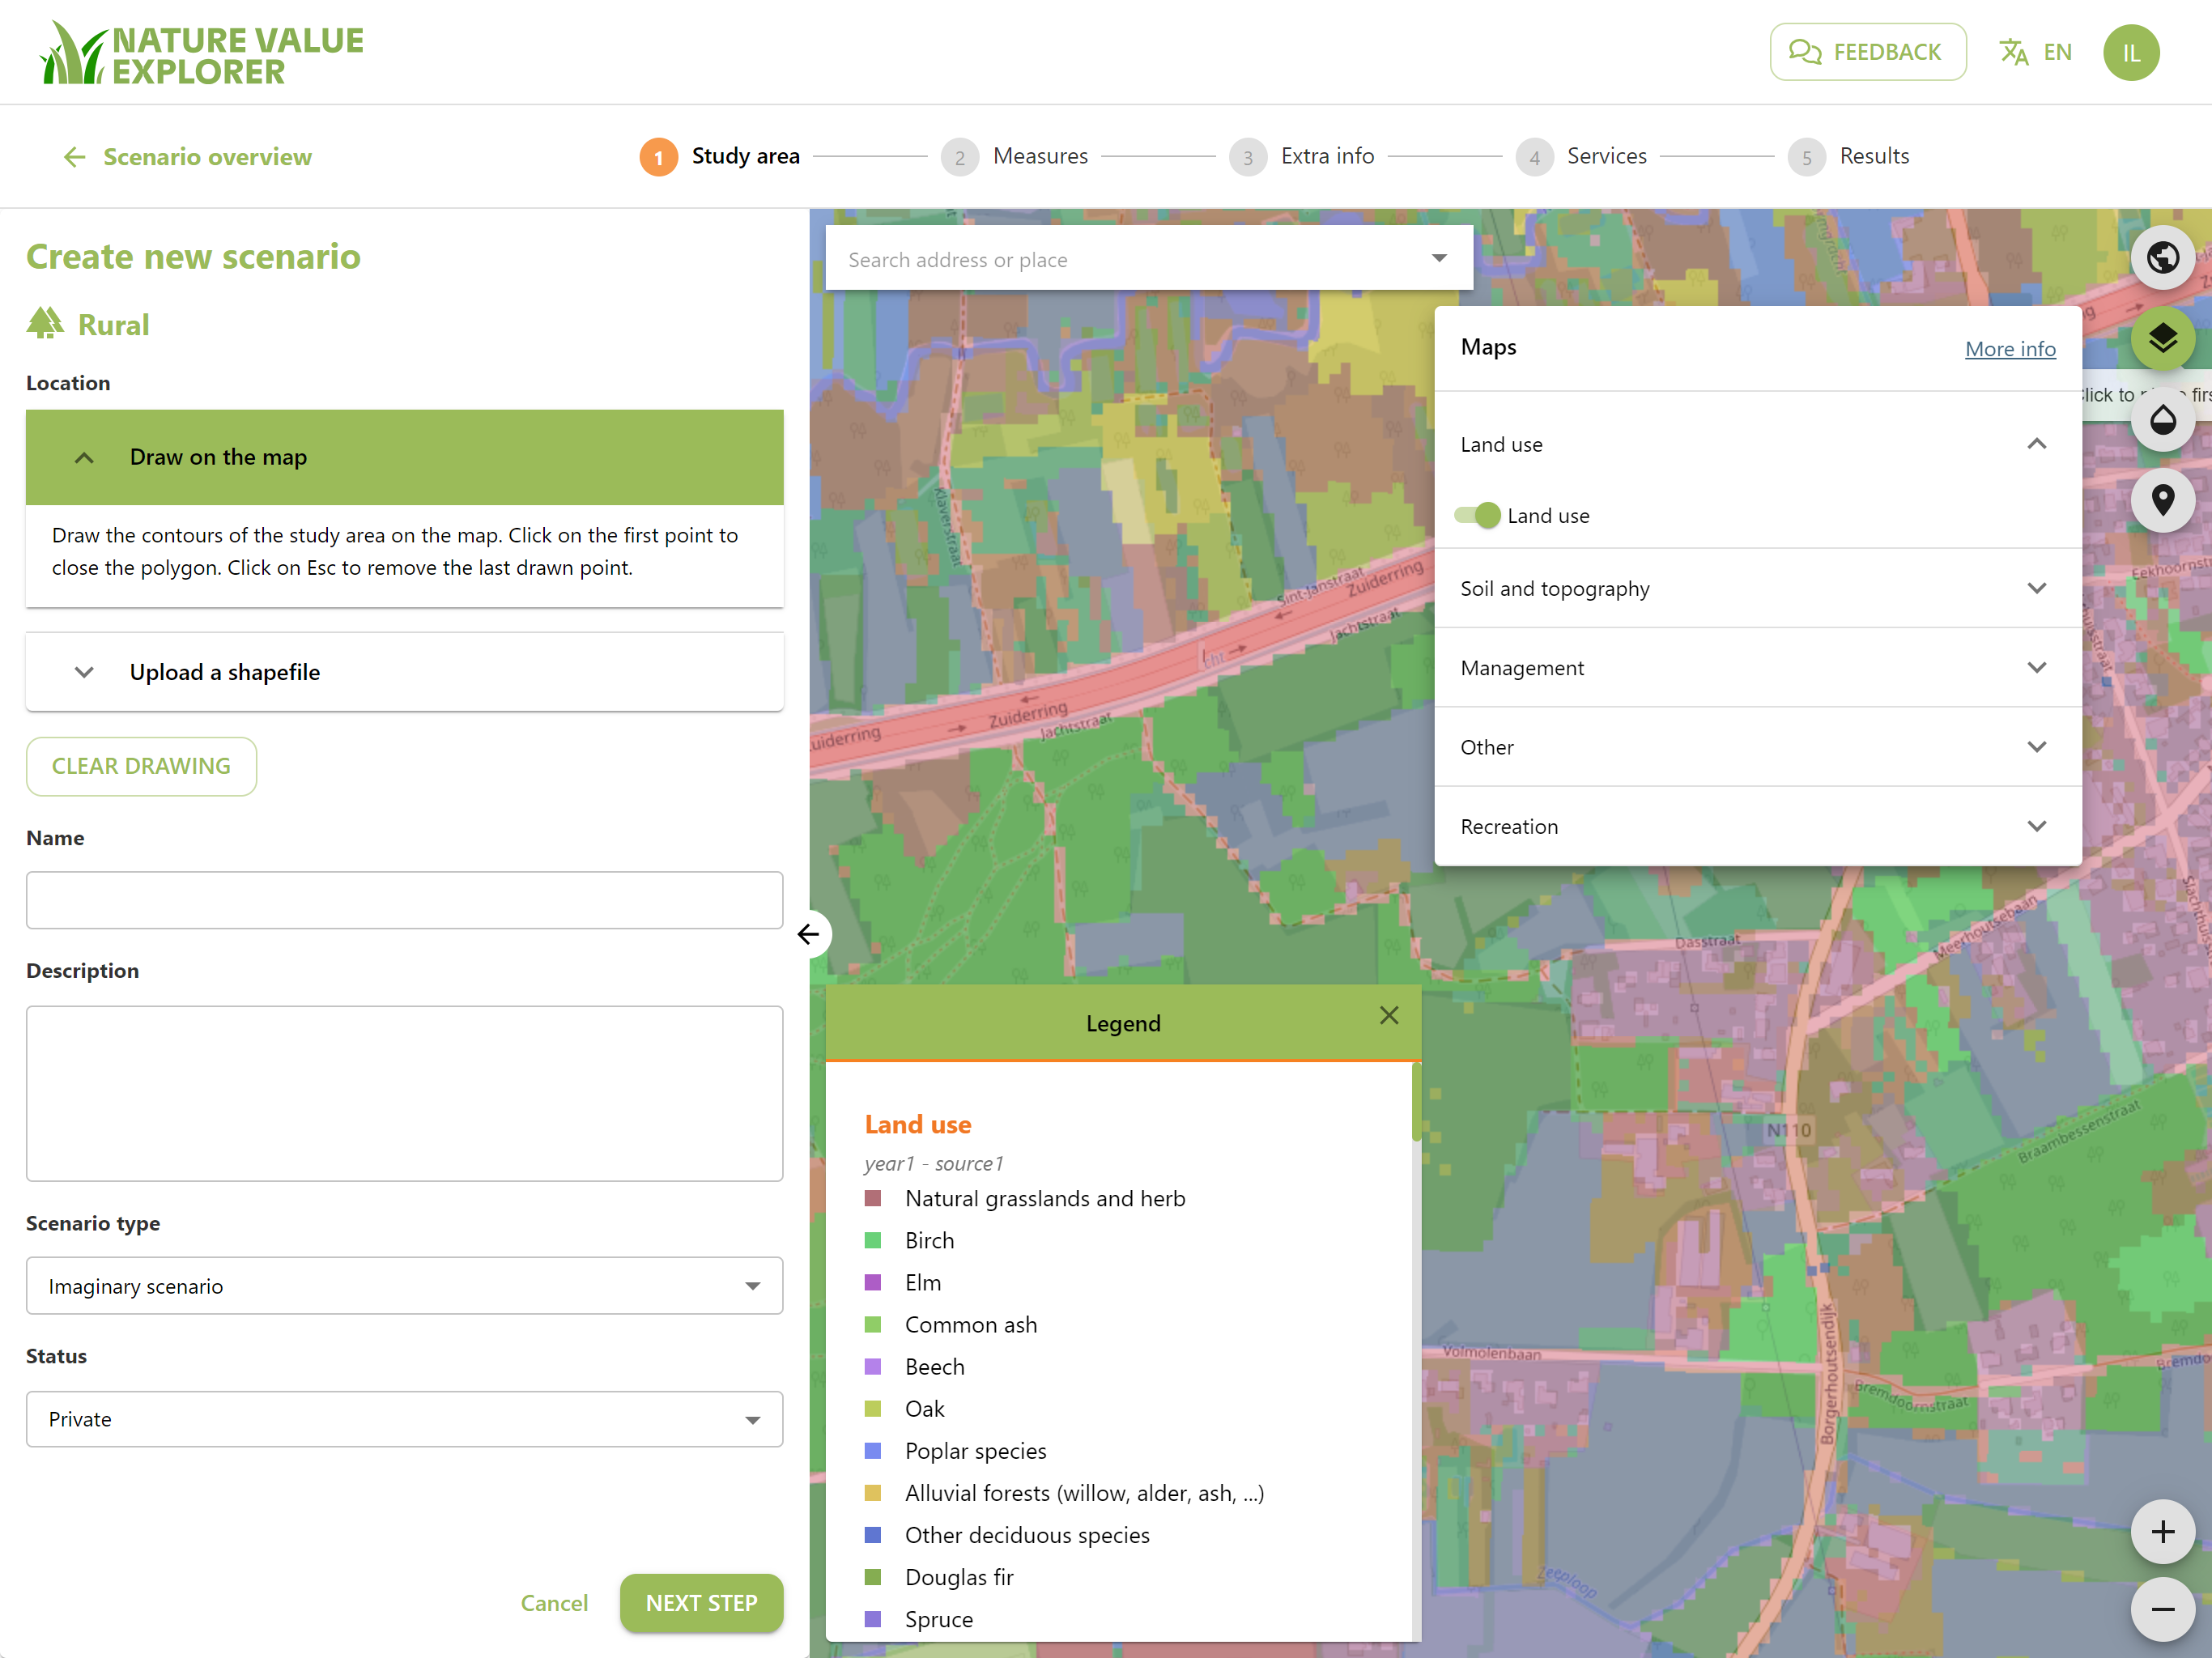
When you select a map you can adjust the transparency of the map by adjusting the slider ![]() .
.
You turn the input card off again by clicking on it again.
You can return to this or the next step at any time in the process to consult the input maps. If you have opened an input map, you can always click on the map with the left mouse button to know which value is indicated on the map. To do this, the point information ![]() must first be activated.
must first be activated.
When you are done, press the green button "Next Step"